CORRECTION: (May 6, 2019): In the third chart of chapter 1 of the report, the words “RBS” and “RDD” were reversed in the original title. The title has been corrected to read, “Registered voters from RDD were slightly more conservative than those from RBS.” Changes did not affect the report’s substantive findings.
Commercial voter files are used predominantly as sampling sources for surveys of registered voters, but most of the major vote file vendors say that their databases provide coverage of the nonregistered as well. The sample used in this study is drawn from both registered voter (RV) and nonregistered (non-RV) databases marketed by the vendor. This section of the report compares general public samples from random-digit-dial and registration-based sources.
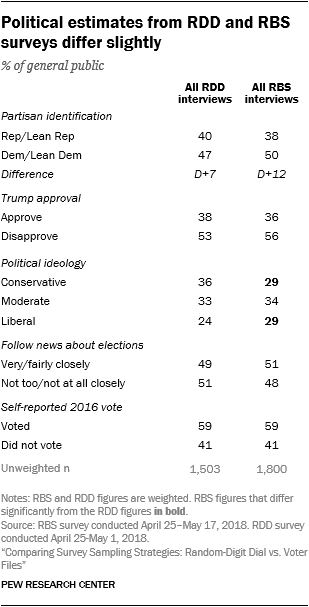
The RDD and RBS samples produce similar results across a wide range of topics. Reported party affiliation, approval of Donald Trump and two measures of electoral engagement – 2016 general election turnout and attention to news about the 2018 elections – are very similar in the two samples.7 On two other measures of attention to news about foreign affairs (the Iran nuclear agreement and negotiations with North Korea), respondents in the RBS sample were slightly more likely than those in the RDD sample to say they had heard “a lot” about these issues.
On a few items, there is a slight tendency for the RDD sample to produce more conservative attitudes and pro-Republican responses, but the differences tend to be quite small. For example, self-described conservatives make up 36% of the RDD sample, compared with 29% of the RBS sample.8 And more respondents in the RDD than the RBS sample say the Republican Party has good policy ideas and high ethical standards. The share saying the U.S. has a responsibility to accept refugees was also lower in the RDD sample (51%) than the RBS sample (56%).
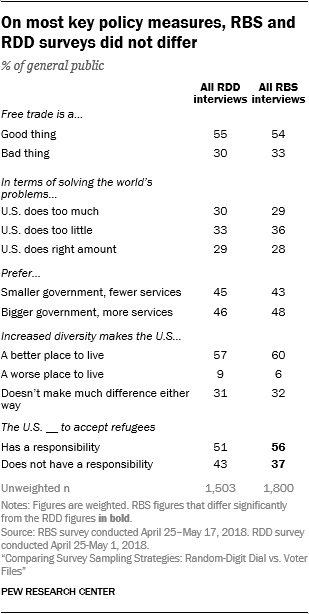
But for the most part, partisan and policy differences between the samples are quite modest. Notably, there is no difference between the estimates produced in the two surveys in opinion about the proper size of government, a key political orientation that has defined the division between Republicans and Democrats for decades. Respondents in both samples are roughly evenly divided over whether we need a bigger or a smaller government.
On a range of specific issues, from support for free trade, to views about increased racial and ethnic diversity, to the U.S.’s proper role abroad, RBS and RDD samples produce equivalent estimates. For example, the share who said free trade is a good thing for the country is nearly identical in the RBS survey and the RDD survey (around 55% in each). Similarly, there is little difference between the surveys in views about whether the U.S. does too much, too little or about the right amount to solve the world’s problems. Views on the death penalty, tariffs and renewable energy hardly differ between the samples.
Even for the small number of items on which statistically significant sample differences are observed, the main conclusions one would draw about the shape of public opinion would be similar, regardless of which sample provided the data.
RBS figures for registered voters tended to tilt more Democratic than those from RDD
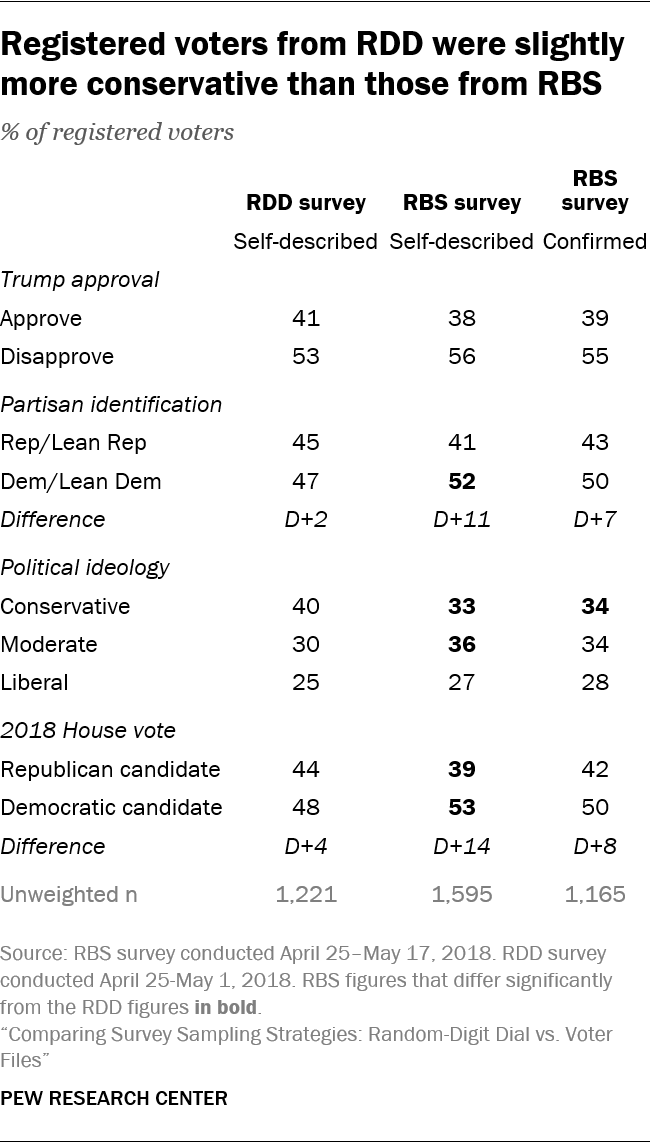
When the samples are narrowed to include only registered voters, somewhat larger political differences emerge. Given that this RBS survey interviewed a broader sample than is typical in practice (e.g., including 385 interviews from a database of nonregistered adults), two sets of weighted registered voter estimates are presented.
The “self-described” RV estimates are based on all RBS survey respondents (whether from the registered or nonregistered databases) who reported being registered to vote at their current address. These estimates provide the best apples-to-apples comparison with the RDD survey, which used the same criterion to define RVs. The “confirmed” RV estimates are not based on self-reporting, but on whether the respondent was identified in the voter file as being registered and confirmed that they were the person named on the file. The confirmed RV estimates presumably come closer to common practice among pollsters using RBS because the estimates are restricted to registered voter file sample.
The RDD and RBS surveys paint somewhat different pictures of registered voter sentiment on the upcoming midterm election. Both surveys (conducted in the spring) show more support for Democratic congressional candidates than Republican ones, but the estimates from the RDD survey suggest a smaller Democratic advantage than estimates from the RBS survey. Among RVs from the RDD survey, 48% choose or lean toward the Democratic candidate, while 44% choose or lean Republican. Among self-described RVs from the RBS survey, 53% choose or lean toward the Democratic candidate, while 39% choose or lean Republican. Results for confirmed RVs in the RBS survey fell in between (50% favoring the Democrat; 42% favoring the Republican).
And while political ideology is a fraught measure,9 it showed a similar pattern. RVs from the RDD poll were more likely to describe their views as conservative (40%) than the confirmed RVs from the RBS poll (34%).
On most policy questions, there was no discernable gap between the RV figures coming from the two polls, as differences fell within the margin of error. The RDD and RBS samples produced highly similar registered voter figures for questions about free trade, unions, the death penalty, the proper size of government and more.
On the few policy items that were appreciably different across samples, the RBS estimates were more liberal than those from RDD. The share of registered voters expressing support for the U.S. developing alternative energy sources over expanding production of oil, coal and natural gas was 69% in the RBS poll versus 64% in the RDD poll. Confirmed RVs from RBS were also more likely to say that the U.S. has a responsibility to accept refugees (57%) than those from RDD (51%).
Why do the RBS estimates tilt slightly more Democratic than those from RDD?
On paper, structural aspects of registration-based sampling seem to make it more effective for reaching Republicans than Democrats. Generally speaking, people must be registered to vote in order to be interviewed in an RBS survey. Studies, including this one, have long found that Republicans and those who lean Republican are more likely to be registered to vote than Democrats and Democratic leaners (72% vs. 64%, respectively, in the RDD survey). Furthermore, phone numbers on the voter file can get out-of-date, especially when people move. A 2016 Center survey found that Republicans are less likely than Democrats to have moved within the last five years (34% vs. 40%, respectively). A person’s chance of getting selected for an RDD survey, by contrast, is not tied to their registration status or how long they’ve lived at their home.
The results from this study showing an RBS sample that tilts, if anything, slightly more Democratic than an RDD sample run counter to these structural considerations. So, what’s going on?
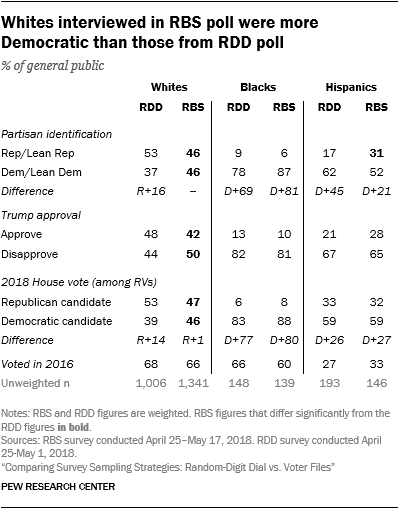
There is no clear answer. Much of that difference between the RDD and RBS results stems from white non-Hispanic adults. Among whites, partisanship is evenly split in the RBS survey (46% identify with or lean to the Republican Party, while 46% identify with or lean to the Democratic Party). The RDD survey shows a 16-point Republican advantage (53% Republican vs. 37% Democrat).
The pattern is reversed for Hispanics. While Hispanics in both surveys are more likely to identify with or lean Democratic than Republican, the RDD survey produces a larger Democratic advantage than the RBS survey. Among self-identified Hispanics, there is a 45-point partisan gap in favor of Democrats in the RDD survey (62% Democratic vs. 17% Republican), compared with a 21-point gap in the RBS survey (52% Democratic vs. 31% Republican). Put another way, Hispanics in the RBS survey are nearly twice as likely as Hispanics in the RDD survey to identify as Republicans (31% vs. 17%). But the Hispanic population is one-quarter the size of the white population in the U.S., so patterns among whites tend to outweigh patterns among Hispanics in estimates for the entire adult population. There was no clear explanation as to why whites reached by RBS differed from those reached by RDD. A look at the educational and regional distributions within the two samples of whites revealed no major differences.


