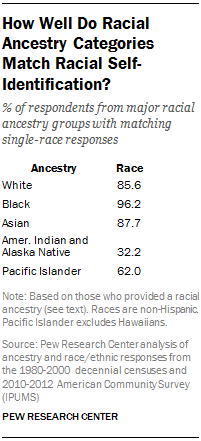
We use information on respondent ancestry reported in the 1980-2000 decennial censuses and the 2010-2012 American Community Survey (ACS) to estimate the proportion of the population with two significantly different racial ancestries. The ancestry question is an open-ended question that allows respondents to report up to two ancestries. The three-year 2010-2012 ACS was used, rather than a single-year estimate, in order to have adequate sample size for small groups.
Using the 2010-2012 ACS for purposes of illustration, 227 detailed ancestries were enumerated. Loosely following work by sociologists Aaron Gullickson and Ann Morning59, the detailed ancestries (German, Jamaican, etc.) were collapsed into six racial ancestry categories. Respondents of “biracial ancestry” are defined as those whose first and second ancestries are different racial ancestries.
The racial ancestry categories include the five races designated by the Office of Management and Budget for use on federal surveys (white; black; American Indian and Alaska Native; Asian; and Pacific Islander, not including Hawaiian). The sixth category is a residual including the reported ancestry “mixture” and other detailed ancestries with no preponderant racial identification.
The detailed ancestries were mapped into the six racial ancestry categories using responses to the ACS race question. Detailed ancestries in which at least 75% of respondents identified with a single race on the race question were assigned to the corresponding racial ancestry. (In the 2010-2012 ACS, 83% of ancestries met that 75% threshold.) For example, 79% of ACS respondents with Ecuadorian ancestry identify themselves as white on the race question, so people with Ecuadorian ancestry are classified as white.
Ancestries such as Eurasian, Amerasian or Hawaiian were assigned to the mixture and other category because they do not have a dominant racial identity and a significant share of respondents identify as two or more races on the race question. The same assignment was made for many detailed Central American ancestries, where respondents often identify as “some other race” on the race question. Finally, most of those reporting American Indian ancestries were classified as American Indian and Alaska Native, even though those respondents were more likely to choose white than American Indian on the race question. The assignment was made in order to have adequate sample size for analysis.

Responses such as “United States,” “Texas,” and “North American” could not be assigned a racial ancestry and are not included in the analysis.
The accompanying table reports the racial and Hispanic question responses for people in five collapsed racial ancestry groups. Except for American Indians and Alaska Natives, the assigned racial ancestry generally matches respondents’ racial and ethnic identification. For example, 86% of respondents of white racial ancestry report themselves as non-Hispanic white on the race and ethnicity questions. Among those in the mixed and other category (not shown), 74% identified as Hispanic.
Morning and Gullickson also use ancestry data to estimate the size of the population of multiracial background. There are some notable differences between their analysis and this Pew Research Center analysis. They examine only responses of heads of households. Additionally, using a similar method to ours, they collapse the detailed ancestry responses down to 10 racial categories, rather than six. Nonetheless, we produce similar results: Their analysis of 1990 census data indicates that 3.1% of household heads have two different racial ancestries, and ours found that 2.9% of the 1990 population had two-race ancestry.
2000 Data on Ancestry
Due to an unusually low response to the ancestry question on the 2000 census, we provide an additional estimate of the size of the multiracial ancestry population for 2000 based on the Census 2000 Supplementary Survey (C2SS). In the 1980 and 1990 censuses and the 2010-2012 American Community Survey, nearly 90% of respondents reported at least one ancestry. In the 2000 census, 81% did.60
The C2SS was a pilot survey for the Census Bureau’s American Community Survey, which was designed to replace the decennial census long form with an annual data collection of the same information. The ancestry question wording was identical on both the census and survey questionnaires.61
However, the 2000 census collected information from a far higher number of respondents, about 43 million, compared with about 330,000 for the C2SS. In addition, the C2SS included only the household population, while the 2000 census covered the entire U. S. resident population. In order to present comparable numbers, we analyzed only the household population from the 2000 census, excluding group quarters such as hospitals, college dormitories and prisons.
The 2000 census suggests that about 2.5% of the 2000 household population is of multiracial ancestry, compared with 3.4% of the population in the C2SS.
The C2SS estimate is substantially higher, in part, because of higher response to the ancestry question in that survey. A higher share of C2SS respondents provided an ancestry that could be mapped into a racial category—81%, compared with 73% of 2000 census respondents.
Three factors may help explain the higher response rate in the survey. Question wording was identical, but question placement differed. In the 2000 census, ancestry was asked before questions on nativity (place of birth and citizenship), whereas in C2SS ancestry followed the nativity questions. Second, if information was missing on the survey questionnaire, phone interviewers would try to contact respondents to obtain the information. In the 2000 census, due to time constraints and insufficient funding, follow-up was not done. Thirdly, the C2SS had a higher share of cases with interviewer assistance; the 2000 census had a higher share where respondents filled out their own forms.