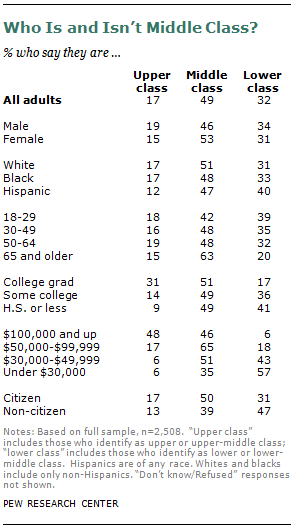
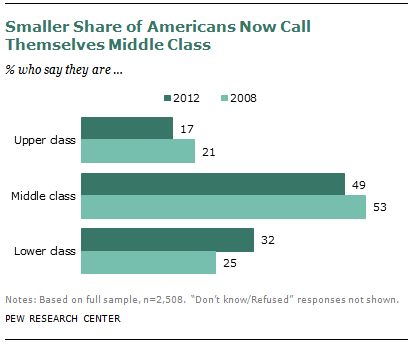
Asked to place themselves on a five-step socioeconomic ladder, about half of Americans (49%) say they are in the middle, according to the Pew Research survey. In a similar survey taken in 2008, 53% of adults placed themselves in the middle class.
An additional 17% of the public places itself in the upper or upper middle class, and nearly a third —32%—in the lower or lower middle class.7 Both proportions have changed since a Pew Research Center survey conducted in early 2008, after the Great Recession began in December 2007 but before its impact was widely felt. The share of the public placing itself in the upper class has declined from 21% since 2008, while the lower-class share rose from 25%.
The share of adults who identify themselves as middle class varies by age but shows little difference by race or Hispanic origin. Analyzed by other characteristics, responses do not vary by educational attainment, but they do vary by gender, marital status and citizenship.
Age Groups
The oldest adults are more likely to identify themselves as middle class than are adults younger than age 65. Among adults ages 65 and older, 63% describe themselves as middle class, compared with 48% of adults ages 30 to 49 and 50 to 64. Among young adults, ages 18 to 29, 42% call themselves middle class.
Young adults are the only age group less likely to describe themselves as middle class now than in 2008, when 54% did. These young adults also are more likely to place themselves in the lower class in 2012 (39%) than in 2008 (25%). In fact, the share of young adults who self-identify as lower class is statistically no different from the share who identify as middle class, while in 2008, the middle-class proportion was double that of the lower class.
Race and Hispanic Origin
By race and Hispanic origin, there is little variation in the proportion of Americans who say they are middle class, or who said so in 2008. However, Hispanics (40%) are more likely than whites (31%) to call themselves lower class. Whites (17%) are more likely than Hispanics (12%) to self-describe as upper class.
The share of Americans who say they are lower class has risen since 2008 for both whites (when it was 23%) and Hispanics (30%), but is unchanged for black adults (33%). Because of the rising tendency of whites to call themselves lower class, there is no difference today in the share of whites and blacks who identify themselves as lower class. In 2008, a higher share of black adults than white adults identified as lower class.
The share of whites who say they are upper class, 17%, has declined from 23% in 2008. Furthermore, the share of whites who include themselves in the upper class is now equal to the share of blacks who do; in 2008, there was a higher share of self-described upper-class whites.
Gender, Marital Status, Education, Income
According to the Pew Research survey, in 2012, a higher share of women (53%) than men (46%) place themselves in the middle class. In 2008, there was no difference in the share of men (51%) and women (54%) who called themselves middle class.
The share of both men and women who identify themselves as middle class appears to have declined since 2008, though the change is statistically significant only for men. However, both genders are now more likely to describe themselves as lower class. For men the share who self-describe as lower class rose to 34% in 2012 from 25% in 2008; for women, it rose to 31% in 2012 from 24% in 2008. The share of men and women who call themselves upper class appears to have declined since 2008, but the change is statistically significant only for women.
Married adults (55%) are more likely to identify themselves as middle class than are unmarried adults (44%). This is true for each subgroup of unmarried adults—those who are living with a partner (40%); separated, divorced or widowed (46%) or never married (43%).
There are few differences by educational attainment when it comes to Americans’ self-description as middle class. However, 31% of college-educated Americans call themselves upper class, compared with less than 11% among those who did not attend or complete college. At the other end of the scale, 39% of those who did not attend or graduate from college describe themselves as lower class, compared with 17% of college graduates.
Among those with family incomes from $50,000 to $99,999 a year, 65% place themselves in the middle class; so do 51% of people in households with annual incomes of $30,000 to $49,999.
However, the appeal of self-identifying with the middle class is such that even 46% of those with family incomes of $100,000 or more say they are middle class, as do 35% of Americans with family incomes under $30,000.
Looked at by immigrant generation, there is not a statistically significant difference in the share of adults identifying as lower, middle or upper class among those born in the U.S. compared with those born abroad. However, citizenship is a dividing line: Half of citizens say they are middle class, compared with only 39% of non-citizens.
Comparing Survey and Census Data
How do these survey results square with Census Bureau data analyzed elsewhere in this report? The share of adults who self-identify as middle class in the survey is about equal to the share of adults living in households defined as middle income using census data (with a size-adjusted household income that is two-thirds to double the overall median size-adjusted household income). Based on Census Bureau data, the share of all households that are middle income declined in the decade from 2001 (54%) to 2011 (51%).8 Based on data from the Pew Research surveys, there was a decline of four percentage points between 2008 and 2012 in the share of adults who define themselves as middle class.