Asian Americans report a generally positive set of attitudes and experiences on a wide range of measures that track how they interact with other racial and ethnic groups. Their most distinctive pattern comes in the most intimate realm of intergroup relations: marriage. Fully 28% of Asian-American newlyweds in 2010 married a non-Asian, the highest rate of “out marriage” among the four major racial and ethnic groups in the U.S.
Asian Americans also reach across racial lines in other ways. For example, just four-in-ten (41%) say that a majority of their friends share their same Asian heritage. This figure rises to nearly half (49%) among Asians who are immigrants but drops to just 17% among those who were born in the United States.
Asked to assess how well they believe Asians and other racial or ethnic groups in the U.S. get along, survey respondents offer a mixed evaluation. Asian Americans are most positive about relations with whites and other U.S. Asian groups. They are less positive about relations with Hispanics and most negative about relations with blacks. Korean Americans have an especially negative view of group relations with blacks—50% say the two groups do not get along well; just 4% say they get along “very well” and 39% say they get along “pretty well.”
Native-born Asian Americans tend to see intergroup relations in a more positive light than do foreign-born Asian Americans. The same pattern holds for attitudes toward intermarriage; foreign-born Asian Americans have mixed views about this phenomenon, while overwhelming shares of the native born say they would be “very comfortable” if a child of theirs married someone outside their own Asian group.
In general, Asian Americans register fairly low levels of concern about group discrimination. Only about one-in-eight (13%) say they consider discrimination against their Asian group to be a major problem, while 48% say it is a minor problem and 35% say it isn’t a problem. (While question wording differs somewhat, findings from other Pew Research surveys suggest that blacks and Hispanics are much more inclined than Asians to see discrimination against their group as a problem.) Also, about six-in-ten Asian Americans say that being a member of their racial group makes no difference when it comes to getting into college or finding a job. Of the remainder who believe it does make a difference, slightly more say it helps than say it hurts.
The rest of this chapter examines attitudes about intergroup relations from multiple perspectives. It provides breakdowns among the six largest Asian country of origin groups; among the native born and the foreign born; and wherever relevant by age and levels of education.
Social Integration
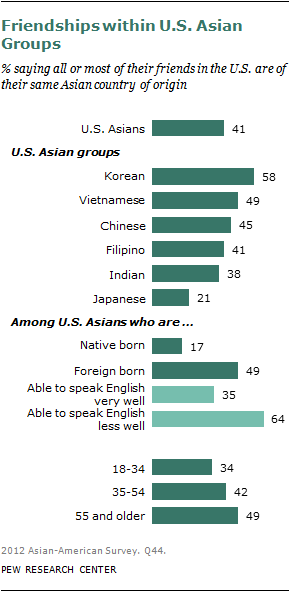
About four-in-ten (41%) Asian Americans say that all (6%) or most (35%) of their friends in the U.S. are from the same Asian country of origin, while 58% say that some, hardly any or none of their friends share their Asian country of origin.
Immigrants are more likely than those born in the U.S. to report that all or most of their friends are from their same Asian country of origin group. About half (49%) of foreign-born Asian Americans say all or most of their friends share their Asian country of origin, compared with 17% among those born in the U.S.
Those with better English skills have a more mixed social circle. Among the foreign born who speak English very well, 35% say that all or most of their friends share their country of origin; this compares with 64% among those with weaker English skills.
Older Asian Americans more so than younger adults have all or most of their friends within the same country of origin group. About half (49%) of Asian Americans ages 55 and older say all or most of their friends share their country of origin. This compares with 34% among younger adults (ages 18 to 34).
There are no differences between men and women in this regard.
There is some variance across U.S. Asian groups in the composition of their social networks. Korean Americans are especially likely to have all or most of their friends from the same heritage (58%); by contrast, just a fifth (21%) of Japanese Americans—a majority of whom are native born—say that all or most of their friends share the same heritage. Chinese Americans fall in the middle, with 45% having all or most of their friends of Chinese heritage. There are large differences between native- and foreign-born Chinese Americans, however. Among the native born, 14% say that all or most of their friends are Chinese American; this compares with 55% among Chinese immigrants. The same pattern occurs for native- and foreign-born Filipino Americans and to a lesser degree among native- and foreign-born Japanese Americans. Other U.S. Asian groups do not have a large enough sample of native-born respondents for analysis.
Intergroup Relations
Do Asian Americans get along with other racial and ethnic groups? The Pew Research survey asked respondents to rate how well members of their Asian group (such as Vietnamese Americans, Korean Americans) get along with each of four groups: whites, blacks, Hispanics and Asian Americans from different countries.
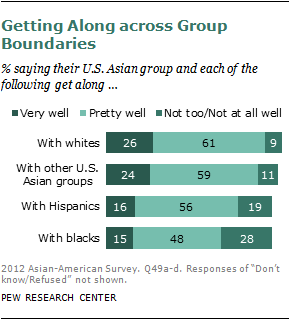
Asian Americans are most positive about relations with whites and other U.S. Asian groups. They are less positive about relations with Hispanics and most negative about relations with blacks.
About a quarter (26%) of Asian Americans say their Asian country of origin group gets along “very well” with whites, 61% say their group gets along “pretty well” and 9% say their group gets along “not too” or “not at all” well. Relations across U.S. Asian groups are seen in similar terms: a quarter (24%) say their group gets along very well with Asian Americans from different countries, 59% say pretty well and 11% say not too well or not at all well.
Intergroup relations with Hispanics are a bit less positive. A 56% majority of Asian Americans see their group and Hispanics as getting along pretty well while roughly equal proportions see relations more positively (16%) or more negatively (19%) than that.
Relations with blacks are considered the most negative of the set. A plurality (48%) of Asian Americans says their group gets along with blacks pretty well, 15% say very well, and about three-in-ten (28%) say not too well or not at all well.
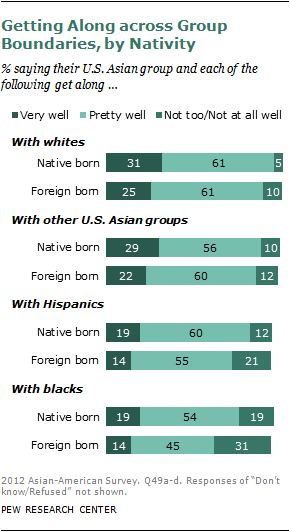
U.S.-born Asians tend to give more positive assessments than the foreign born about the relationship between their country of origin group and other racial and ethnic groups. For example, 31% of native-born Asian Americans say their country of origin group gets along “very well” with whites, compared with 25% of foreign-born Asian Americans who say the same.
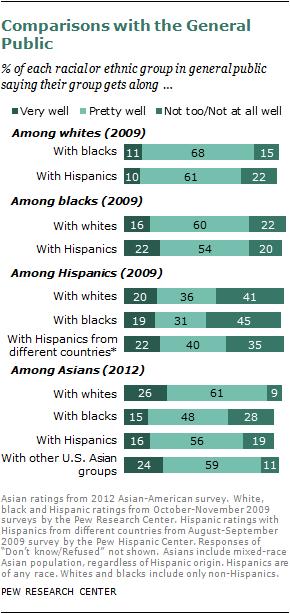
A 2009 Pew Research survey among whites, blacks and Hispanics in the general public asked a similar set of questions. A majority of whites and blacks in the general public consider their racial group as getting along “pretty well” with the other racial group (either blacks or whites, respectively).56 Among those who don’t say “pretty well,” the balance of opinion is slightly more negative than more positive for both whites’ assessment of their relationship with blacks and blacks’ assessment of their relationship with whites.
Hispanics’ views of relations with both whites and blacks are more negative, however. Among Hispanics, two-in-ten say their ethnic group gets along very well with whites, 36% say the two groups get along pretty well, and four-in-ten (41%) say the two groups get along not too well or not at all well.
A sizable minority of Hispanics are negative in their assessments of relations within the Latino community. About a fifth (22%) say Hispanics from different countries get along very well, four-in-ten (40%) say pretty well and 35% say Hispanics from different countries get along not too well or not at all well. By comparison, Asian Americans are more upbeat in their assessments of relations across Asian groups.
Six U.S. Asian Subgroups
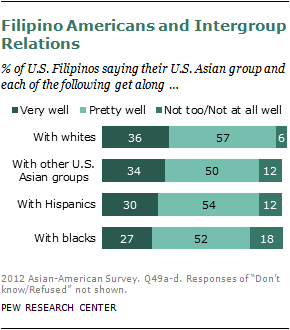
Turning to intergroup relations among each of the six largest U.S. Asian groups, Filipino Americans tend to be more positive about their group’s relations with the four other groups. Korean Americans and Vietnamese Americans are the most negative in their assessments of relations with whites, blacks and Hispanics.
Among Filipino Americans, about a third (36%) see their group as getting along very well with whites, 57% say the two groups get along pretty well and just 6% say not too well or not at all well. Evaluations of relations among Filipino Americans and other U.S. Asian groups are similarly positive (34% very well, 50% pretty well and 12% not too well or not at all well). About three-in-ten Filipino Americans say their group gets along very well with Hispanics and blacks (30% and 27%, respectively).
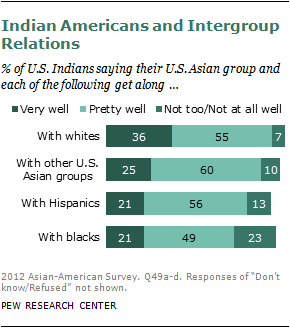
Indian Americans are more positive about relations between their group and whites than they are about relations with other racial or ethnic groups. About a third (36%) say Indian Americans get along with whites very well, and an additional 55% say the two groups get along pretty well; just 7% say not too well or not at all well. Indian Americans are less likely to rate relations with other groups as strongly positive. A quarter (25%) say Indian Americans get along with other Asian groups very well, 21% say the same about relations with Hispanics and with blacks. Indian Americans are more negative in their assessments of Indian-black relations than they are about Indian-white relations. About a fifth (23%) says Indian Americans and blacks get along not too well or not at all well; 7% say the same about Indian Americans and whites.
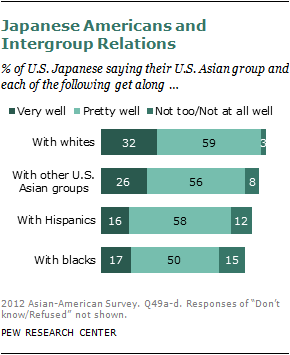
Among Japanese Americans, about a third (32%) say their country of origin group gets along with whites very well, 59% say the groups get along pretty well and just 3% say not too well or not at all well. A quarter (26%) say Japanese Americans get along with other Asian groups in the U.S. very well, 56% say pretty well and 8% say not too well or not at all well. About one-in-six (17%) Japanese Americans say their group gets along with blacks very well, half (50%) say pretty well and 15% say not too well or not at all well. The remainder of 17% gave no rating. Similarly, 16% say Japanese Americans and Hispanics get along very well, about 58% say pretty well and 12% say the two groups get along not too well or not at all well, with the remainder of 15% giving no rating.
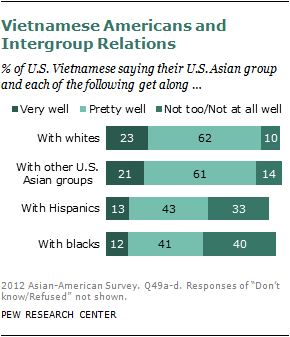
Among Vietnamese Americans, about twice as many say their country of origin group and whites get along very well (23%) as not too well or not at all well (10%); 62% say the groups get along pretty well. Similar percentages say the same about how well Vietnamese Americans get along with other Asian groups in the U.S. (21% very well, 61% pretty well, 14% not too well or not at all well). Vietnamese Americans are more negative about relations with both Hispanics and blacks. Roughly one-in-ten (13%) Vietnamese Americans say their group gets along with Hispanics very well, 43% say pretty well and a third (33%) say not too well or not at all well. Similarly, 12% say Vietnamese Americans and blacks get along very well, about four-in-ten (41%) say they get along pretty well and a roughly equal portion (40%) say the two groups get along not too well or not at all well.
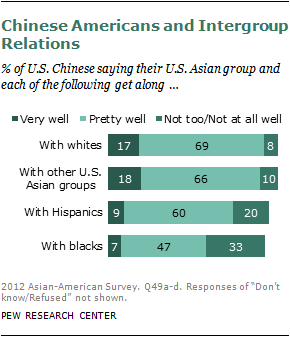
Chinese Americans are more positive in their assessments of relations with whites and with Asian Americans from different countries than with either Hispanics or blacks. Roughly two-thirds of Chinese Americans say their group gets along with whites pretty well (69%), an additional 17% say very well and just 8% say not too well or not at all well. Similarly, 66% say Chinese Americans get along with other Asian groups in the U.S. pretty well, 18% say very well and 10% say not too well or not at all well. Chinese Americans are less positive about relations with Hispanics and blacks. More say Chinese Americans and Hispanics get along not too well or not at all well than say they get along very well (20% and 9%, respectively); six-in-ten (60%) say these groups get along pretty well. And when it comes to relations between Chinese Americans and blacks, a 47% plurality say the two groups get along pretty well, a third (33%) say the groups get along not too well or not at all well and just 7% say the two groups get along very well.
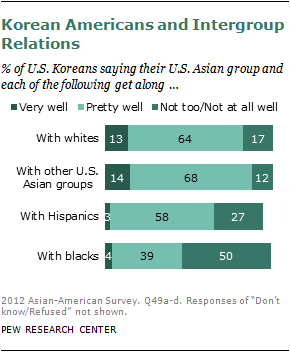
Compared with other U.S. Asian groups, Korean Americans have an especially negative view of relations with blacks. They (along with Vietnamese Americans) are more negative than other U.S. Asian groups in their assessments of relations with Hispanics. About two-thirds (68%) say Korean Americans get along with other U.S. Asian groups pretty well, 14% say very well and 12% say not too well or not at all well. Assessments of the relationship between Korean Americans and whites are similar; 13% say whites and Korean Americans get along very well, 64% say pretty well and 17% say not too well or not at all well. Just 3% say Korean Americans and Hispanics get along very well, 58% say pretty well and 27% say not too well or not at all well. Relations with blacks are seen in more negative terms. Just 4% say Korean Americans and blacks get along very well, four-in-ten (39%) say pretty well and half (50%) say the two groups get along not too well or not at all well.
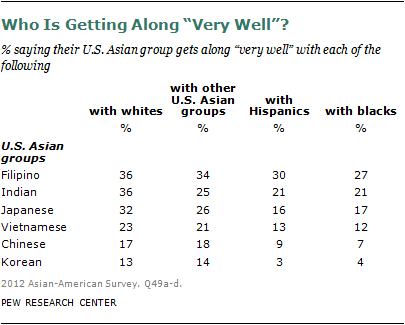
Looking across these ratings, Filipino Americans give the most positive assessments about intergroup relations and Korean Americans give the least positive.
Intergroup Marriage
Another way to consider intergroup relations is by looking at the behaviors and attitudes of Asian Americans toward marriage across racial and ethnic lines. Pew Research analyses of the U.S. Census Bureau’s American Community Survey data on interracial marriage find that Asian Americans are more likely to marry across racial and ethnic lines than are whites, blacks or Hispanics.57
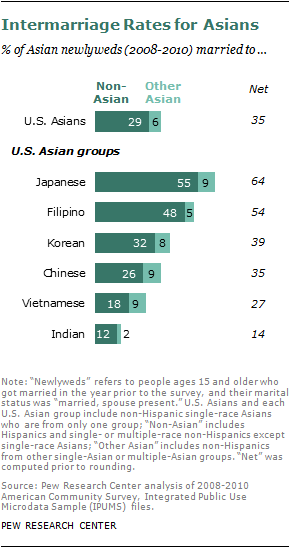
Among all Asian-American newlyweds from 2008 to 2010, 29% married someone who is not Asian and 6% married someone from a different Asian country of origin.58
The propensity to marry across Asian ethnic and racial lines varies widely among U.S. Asian groups. Indian Americans are least likely to marry someone outside their country of origin or racial group. Just 12% of new marriages with an Indian American are to someone of another race and 2% are to non-Indian Asians.
Japanese Americans and Filipino Americans are most likely to marry someone who is not Asian. Among new marriages with a Japanese American, more than half (55%) are to a non-Asian and 9% are to an Asian from a different country of origin. About half (48%) of new marriages of Filipino Americans are to a non-Asian; 5% are to an Asian from a different country of origin.
Attitudes about Intergroup Marriage
Attitudes about intergroup marriage are mostly consonant with the higher interracial and interethnic marriage rates of Asian Americans. The Pew Research survey asked respondents to rate how comfortable they would be if a child of theirs married someone of a differing background.
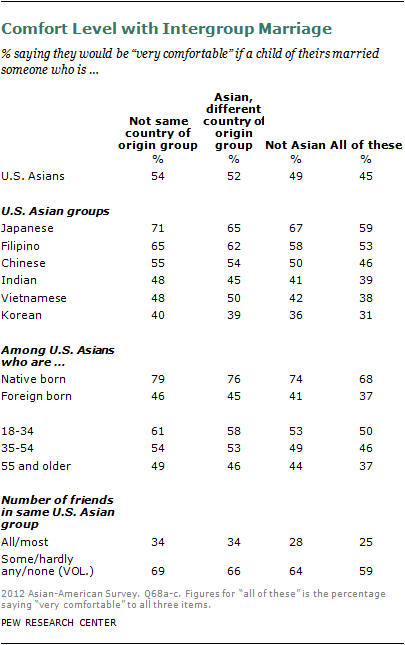
About half (54%) of Asian Americans would be “very comfortable” if their child married someone outside of their country of origin, about three-in-ten (28%) would be somewhat comfortable with this and just 13% would be not too comfortable or not at all comfortable.
The findings are similar when considering a child’s marriage to an Asian from a different country of origin. About half (52%) would be very comfortable with this, three-in-ten (31%) would be somewhat comfortable and 13% would be not too comfortable or not at all comfortable.
About half of Asian Americans (49%) would be very comfortable if their child married a non-Asian, 29% would be somewhat comfortable and 18% would be not too comfortable or not at all comfortable with this.
Taken together, 45% of Asian Americans would be “very comfortable” with all three of these situations: a child of theirs marrying someone who is not from their country of origin, Asian but from a different country of origin, and not Asian.
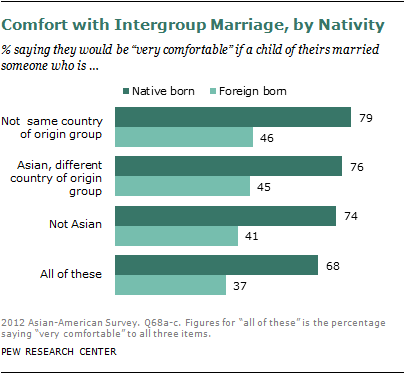
There is a strong association between nativity and age with views about intergroup marriage. Among Asian immigrants, 46% would be very comfortable with a child marrying someone from a different country of origin. Most native-born Asian Americans are comfortable with intergroup marriage; about eight-in-ten (79%) would be very comfortable with a child marrying someone from a different country of origin group. This pattern holds across the set. Taken together, 37% of Asian immigrants say they would be very comfortable in response to all three questions about intergroup marriage; 68% of the native born say the same.
Younger Asian Americans also tend to be more comfortable with intergroup marriage than older Asian Americans. Half (50%) of younger adults (ages 18 to 34) say they would be very comfortable in response to all three questions about intergroup marriage, 37% of those ages 55 and older say the same. Those with a social network that consists largely of others in the same Asian country of origin group are less comfortable with intergroup marriage than are those with a wider mix in their social circle.
Looking across Asian groups, Americans of Korean, Vietnamese and Indian origin are less comfortable with intergroup marriage. Japanese Americans and Filipino Americans are the most likely of the six to be very comfortable with intergroup marriage by race and ethnicity. Among Japanese Americans, those who were born in the U.S. are more comfortable than the foreign born with intergroup marriage. For example, 75% of native-born Japanese Americans would be very comfortable if their child married someone who was not Asian; 56% of foreign-born Japanese Americans say the same. The same pattern occurs among other Asian subgroups with large enough samples of native and foreign born for analysis: Chinese Americans and Filipino Americans.
Views on Interracial Marriage in the General Public
The general public also tends to be broadly accepting of interracial and interethnic marriage. A Pew Research survey of the general public in 2009 included a similar series of questions.59 When asked if an immediate family member married someone from each of four groups—African Americans, Hispanic Americans, Asian Americans and white Americans—respondents rated whether they would “be fine” with it, “would be bothered, but would come to accept it,” or “would not be able to accept it.”60
About six-in-ten adults (63%) in the general public said they would be fine with a family member marrying outside their racial group. Overall, blacks were more accepting than either whites or Hispanics of intermarriage—72% would be fine with a family member choosing to marry someone who was white, Hispanic or Asian American. About six-in-ten whites (61%) would be fine with a family member marrying someone who was African American, Hispanic American or Asian American, and 63 percent of Hispanics would be fine with a family member marrying someone who was African American, Asian American or white American.
Younger adults are more accepting than older adults of intermarriage; age differences are more pronounced among whites than among blacks in the general public.
Of the racial and ethnic groups considered, openness to a family member’s marriage to a white ranks highest and marriage to an African American ranks lowest; openness to a marriage with an Asian American and with a Hispanic falls between these two. About eight-in-ten (81%) non-whites say they would be fine with a family member’s marriage to a white American; three-quarters (75%) of non-Asians say the same about marriage to an Asian American and a similar percentage of non-Hispanics (73%) would be fine with a marriage to a Hispanic American. About two-thirds (66%) of non-blacks say they would be fine with a family member’s marriage to an African American.
Discrimination
Perceptions of discrimination provide another lens through which to view intergroup relations. The Pew Research survey asked several questions about discrimination against respondents’ Asian country of origin group (such as Chinese American, Filipino American and so forth) as well as questions about personal experience with discrimination.
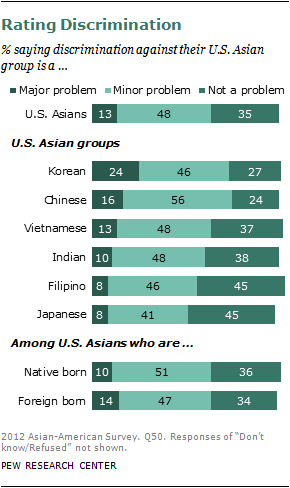
Just 13% of Asian Americans say discrimination against their country of origin group is a major problem, nearly half (48%) say it is a minor problem and 35% say discrimination is not a problem.
Slightly more foreign-born than native-born Asian Americans see discrimination against Asian Americans as a major problem.
Education is inversely related to perceptions of discrimination. Among those with a college degree, about half (52%) say discrimination against their country of origin group is a minor problem and 11% say it is a major problem. Among those with a high school education or less, 39% call discrimination a minor problem and 21% call it a major problem.
Perceptions of discrimination vary somewhat across U.S. Asian groups. Chinese and Korean Americans are more likely than other U.S. Asians to say that discrimination is either a major or minor problem. Korean Americans are more likely than other Asian groups to see discrimination as a major problem.
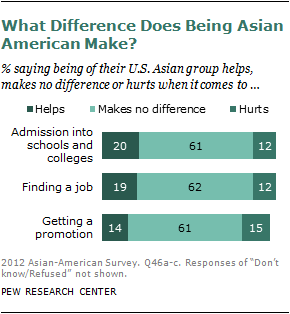
Further, a majority believe that being Asian American makes no difference when it comes to school admission or hiring and promotion decisions. About six-in-ten (61%) Asian Americans say being of their country of origin group (such as Japanese American, Indian American and so forth) makes no difference in admissions to schools and colleges; those with a different view are more likely to say that it helps (20%) than hurts (12%).61
Similar percentages say that being Asian makes no difference when it comes to finding a job (62%), while 19% say it helps and 12% say it hurts.
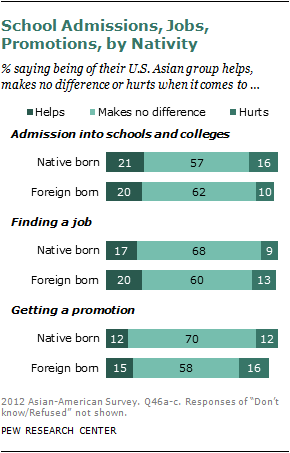
While some observers talk about a “bamboo ceiling” hindering the rise of Asian Americans to top positions, a majority of Asian Americans say that being Asian makes no difference when it comes to getting a promotion at work.62 Among all U.S. Asians, 61% say being from their Asian group makes no difference in promotion decisions once on the job; roughly equal percentages say being from their Asian group helps in getting a promotion (14%) as say it hurts (15%).
Native-born Asian Americans are less likely than those who are foreign born to see their country of origin as a factor when seeking a job and especially for getting a promotion. A greater share of the native born say being of their country of origin group makes no difference when it comes to getting a job or a promotion. And the native born are less likely than the foreign born to say that being of their country of origin hurts for getting a job or a promotion. This pattern differs, however, when it comes to gaining admission to schools and colleges. Native-born Asian Americans, more so than those who are foreign born, say being of their country of origin group hurts their chances of admission.
Views about the effect of being Asian American on admission into schools and colleges tend to vary by education level. Those with less education are more inclined to say that being Asian is an advantage.
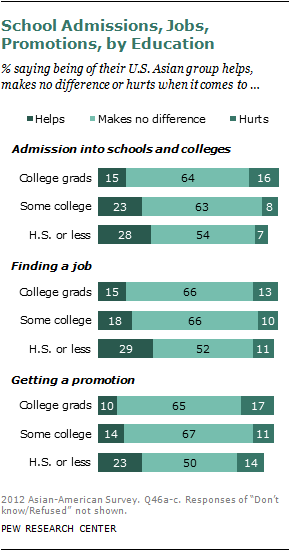
College graduates are about equally likely to say that being of their Asian group helps (15%) or hurts (16%) admission into schools. Asian Americans with a high school diploma or less are more likely to say being of their Asian group is an advantage (28%) rather than a disadvantage (7%) in admissions decisions. About half or more of Asian Americans at any education level believe it makes no difference either way.
A similar pattern occurs when it comes to finding a job. Among college graduates, about equal percentages say being from their Asian group helps (15%) as say it hurts (13%) in job decisions. Those with a high school diploma or less are more likely to say that being from their Asian group is an advantage (29%) than say it hurts (11%). However, about half or more of Asian Americans at any education level say that being from their Asian group makes no difference in getting a job.
When it comes to getting a promotion, college graduates are more likely to say that being of their U.S. Asian group hurts (17%) than helps (10%); 65% say it makes no difference. Among those with a high school diploma or less, 23% say being of their Asian group helps, 14% say it hurts and half (50%) say it makes no difference.
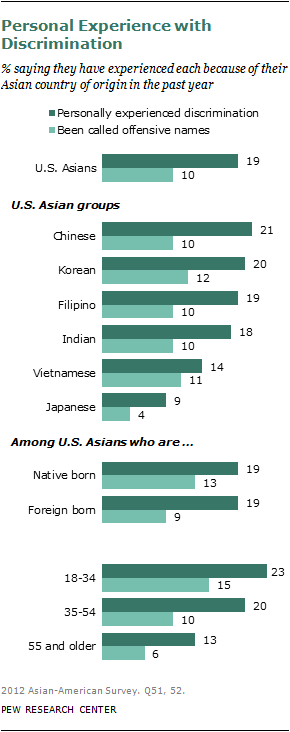
About two-in-ten (19%) Asian Americans say they have personally experienced discrimination because of their Asian heritage within the past year. One-in-ten (10%) say they have been called offensive names in the past year because of their Asian heritage.
More younger adults (ages 18 to 34) than older adults (ages 55 and older) have experienced discrimination and been called offensive names in the past year.
There is modest variation in experience with discrimination across Asian groups. About two-in-ten Chinese, Korean, Filipino and Indian Americans report experiencing discrimination in the past year; Japanese Americans are less likely to have experienced discrimination (9%). And about one-in-ten of each U.S. Asian group say they have been called offensive names because of their country of origin in the past year; among Japanese Americans, that share is even lower at 4%.
Native- and foreign-born Asian Americans are about equally likely to experience discrimination or to have been called offensive names.
The pattern of results across these measures—both perceptions of and personal experience with discrimination—suggests that discrimination is not a major concern among Asian Americans. While not precisely comparable, Pew Research surveys with other racial and ethnic minorities show greater concern about group discrimination.
Surveys by the Pew Research Center and others show strong concern about group discrimination among blacks. For example, in a 2009 Pew Research survey, 43% of blacks said there was “a lot” of discrimination against African Americans, 39% said there was some and 16% said there was little or no discrimination. While not directly comparable to the current survey, this suggests that, relative to blacks, discrimination is of less concern to Asian Americans.63
A similar, though not directly comparable question, asked on a 2010 survey by the Pew Hispanic Center also suggests that Asian Americans have less concern than Hispanics about group discrimination. The Pew Hispanic Center survey asked whether discrimination was a major problem, a minor problem or not a problem “in preventing Hispanics in general from succeeding in America.” In 2010, 61% of U.S. Hispanics called discrimination a major problem, 24% said it was a minor problem and 13% said it was not a problem.64 Direct comparisons across surveys rely on identical question wording due to the effect that sometimes even small variations in wording can have on responses. In this case, the additional qualifier that discrimination prevents Hispanics from succeeding in America may change the meaning of the question and so could account for some or all of the differences between Hispanics and Asian Americans.
As with perceptions of discrimination among Asian Americans, Hispanics immigrants are more likely than those born in the U.S. to say discrimination is a major problem in preventing Hispanics’ success. Similarly, a majority of Hispanics say that discrimination against their group was a major problem in schools and in the workplace, according to a 2007 survey by the Pew Hispanic Center.65
Personal experience with discrimination may also be more common among Hispanics than it is among Asian Americans. While not directly comparable, a 2010 Pew Hispanic Center survey found 34% of Hispanics reported that they, a family member or a close friend experienced discrimination over the previous five years because of their ethnic background. Looking at only personal experiences over a shorter time period, the Pew Research survey of Asian Americans finds about two-in-ten (19%) saying they have personally experienced discrimination or have been treated unfairly in the past 12 months because of their country of origin.


