
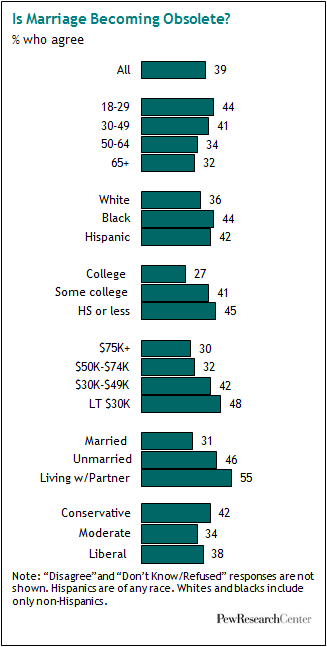
About four-in-ten Americans think that marriage is on the rocks. No, not their marriage. The institution of marriage. In response to the question, “Some people say that the present institution of marriage is becoming obsolete—do you agree or disagree?” some 39% of survey respondents say they agree, while 58% disagree and 4% say they don’t know.
As family historians16 have noted, observations about the fragility of marriage are as old and universal as marriage itself—meaning they’ve been around for thousands of years and permeated virtually every culture and corner of the globe.
Nevertheless, there’s been a notable rise in recent decades in this country in the perception that marriage’s best days are behind it. When this same question was posed on a 1978 survey, just 28% agreed with the premise.17
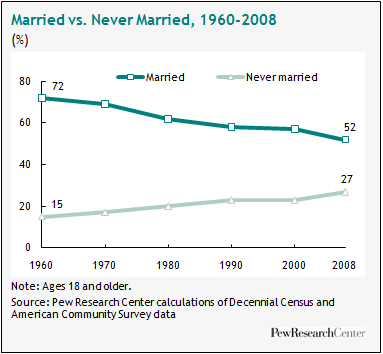
No matter what one thinks about the institution’s future, there’s no getting around its stark contraction during the past half century. Some 72% of all adults in the United States were married in 1960. By 2008, just 52% were.
Does this trend line lead inevitably to obsolescence? The notion that it does attracts some strange bedfellows—those who are contributing to the phenomenon (55% of cohabiters) as well as those who are most likely to be troubled by it (42% of self-described conservatives).
The survey reveals other intriguing cross-currents in the public’s attitudes about marriage. For example, most Americans now embrace the ideal of gender equality between spouses. The mid-20th century “Ozzie and Harriet” marriage between a breadwinner husband and a homemaker wife is now seen as the preferred model by just 30% of the public; some 62% say that marriages are better when husbands and wives both have jobs and both share responsibility for the household and kids.
Even as public opinion embraces the ideal of spousal equality, however, it still hasn’t given up the seemingly contradictory notion that men—far more than women—need to be good providers in order to be good marriage prospects. Two-thirds of survey respondents say this about men, while just one-third say it about women.
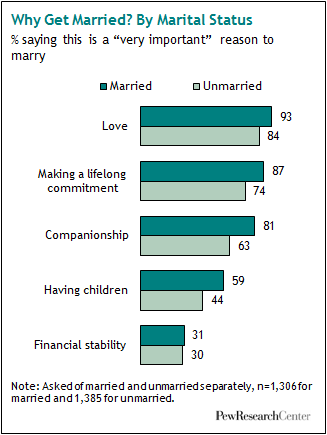
But comes now another wrinkle. To hear the public tell it, financial security isn’t all that important to marriage. Asked to evaluate the reasons they got married, married respondents place the greatest value on love (93% say this is a very important reason), followed by making a lifelong commitment (87%), companionship (81%), having children (59%), and, at the bottom of the list, financial stability (31%). Unmarried adults order the reasons the same way when asked to evaluate why they would consider getting married.
The potency of the link between love and marriage is relatively new in the sweep of human history—and, in the view of some historians, a leading cause of the institution’s decline.18 For several millennia, economic security was the sine qua non of marriage. The institution thrived as an efficient way to divide labor, allocate resources, propagate the species and ensure that someone will take care of you when you get old. Only in recent centuries have love and mutual self-fulfillment come to occupy center stage in the grand marital bargain. But as the trends of the past half century attest, it’s an open question whether a social institution built on love will prove as durable as one built on economic security.
Less Money, Less Marriage
If economic security is no longer a key reason people marry, the lack of economic security nonetheless appears to be a key reason people don’t get married. As noted in the overview of this report, 50 years ago there was virtually no difference by socio-economic status in the proclivity to marry: 76% of college graduates and 72% of adults who did not attend college were married in 1960. By 2008, that small gap had widened to a chasm: 64% of college graduates were married, compared with just 48% of those with a high school diploma or less. During this same period, the income gap between the well-educated and the less-educated—and between the rich and poor—also widened substantially.19
The 2010 Pew Research survey finds that among the unmarried, there are no significant differences by education or income in the desire to get married; just under half of the college educated (46%) and those who have a high school diploma or less (44%) would like to get married. Likewise, roughly similar shares of the unmarried who earn above and below $100,000 a year would like to marry.
But the survey also finds that the less education and income people have, the more likely they are to say that in order to be a good marriage prospect, a person must be able to support a family financially. Taken together, these findings suggest that those with less income and education are opting out of marriage not because they don’t value the institution or aspire to it benefits, but because they may doubt that they (or a potential spouse) can meet the standards they impose on marriage.
The Upsides of Marriage
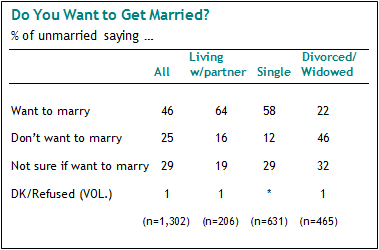
Not all of the survey findings are harbingers of gloom and doom for the institution of marriage. Even among those who are not currently married, getting hitched continues to have appeal. A plurality of 46% of those who are not married say they would like to marry, while three-in-ten (29%) say they are not sure. Just one-in-four say they don’t want to marry.
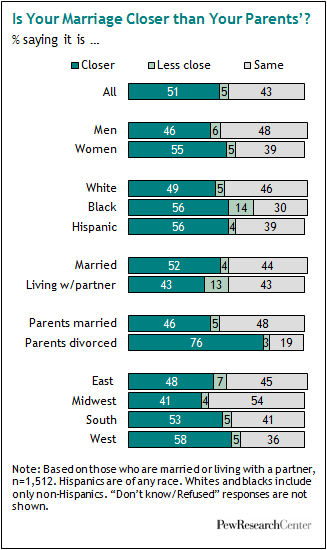
Moreover, marriage may have been more prevalent a generation ago, but most married or cohabiting respondents today believe their own relationship compares favorably with their parents’. Some 51% say they have a closer relationship with their spouse or partner than their parents had with each other, while just 5% characterize their own relationship as less close. The remainder—43%—say there is no difference.
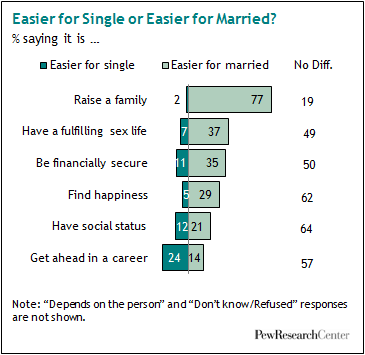
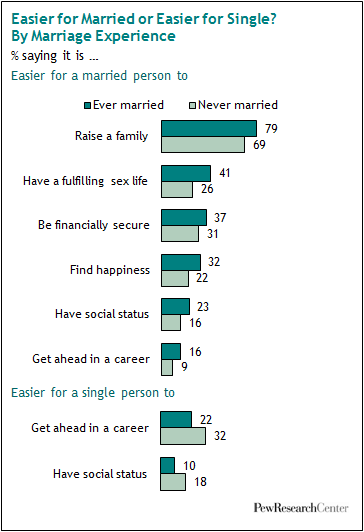
A majority of adults believe that in many key realms of life—such as finding happiness, getting ahead in a career or having social status—it doesn’t make any difference whether a person is married or single. However, among those who believe it does make a difference, most say that being married is better.
For example, when it comes to being financially secure, 35% of respondents believe this is easier to do as a married person, while 11% say it is easier for a single person and half say it makes no difference. Similar patterns emerge for having a fulfilling sexual life, finding happiness and having social status. The two outliers from this pattern are raising a family (fully 77% say this is easier for a married person) and getting ahead in a career (just 14% say this is easier for a married person, compared with 24% who say it is easier for a single person).
Finally, a classic question about love was posed in the survey: Do you agree or disagree that there is only one true love for each person? Nearly three-in-ten (28%) Americans agree, while 69% disagree. Among the minority who believe in just one true love, 79% say—in response to a follow-up question—that they’ve found theirs. And among those in this group who are married, 96% say they’ve found theirs—meaning that virtually all are either deeply committed or very careful with their words.
The remainder of this chapter examines all of these questions in depth and explores the demographic patterns in attitudes and behaviors related to marriage.
Is Marriage Becoming Obsolete?
It’s no small thing when nearly four-in-ten (39%) Americans agree that the world’s most enduring social institution is becoming obsolete. Nonetheless, this finding needs to be interpreted with caution.
For one thing, “becoming obsolete” is not the same as “obsolete.” When the World Values Survey posed a similar question in 2006 that used a more starkly worded formulation (“Marriage is an outdated institution—agree or disagree?”), just 13% of American respondents agreed.
In addition, respondents who doubt the durability of marriage appear to include a mix of those who are comfortable with the change and those who are troubled by it.
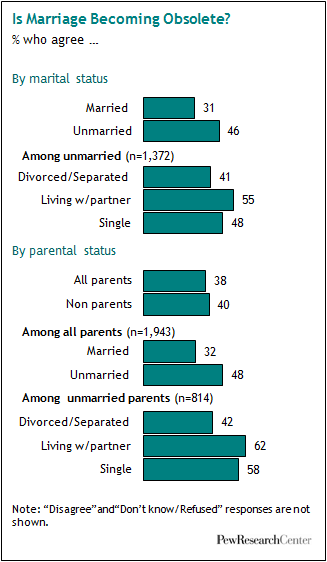
Among the demographic groups most likely to agree that marriage is becoming obsolete are the young (44% of 18- to 29-year-olds say this), blacks (44%), those who have a high school diploma or less (45%) and those whose annual income is less than $30,000 (48%). All of these groups are less likely than their demographic opposites (older, white, college educated, higher income) to be married—and thus their judgments could well be shaped to some degree by their life experiences.
These differences come into sharper focus when one looks specifically at respondents’ marital status. Just 31% of married adults agree that marriage is becoming obsolete, compared with 46% of all unmarried adults, 58% of all single parents and 62% of all cohabiting (but unmarried) parents.
But it’s not just those who are living out alternative arrangements to marriage who say that the institution is becoming obsolete. Some 42% of self-described conservatives (compared with 38% of liberals and 34% of moderates) say the same— even though conservatives are less likely than moderates or liberals to have ever cohabited. They are also the most likely of the three ideology groups to say that the growing variety in family arrangements is a bad thing.
Gender Roles; Family Finances
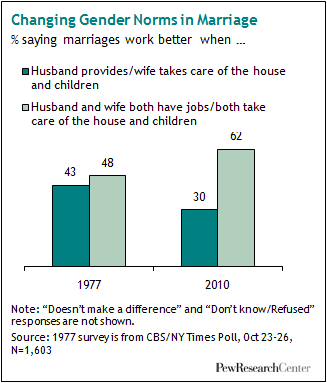
When it comes to attitudes about how spouses should divide responsibilities, social norms have changed. Back in 1977, survey respondents were nearly equally divided between those who said marriages are more satisfying when the husband earns an income and the wife takes care of the household and children (43%) and those who said marriages work best when both spouses have jobs and both take care of the household and children (48%).
By 2010, public opinion shifted heavily in favor of the dual income/shared homemaker model, with survey respondents favoring this template by 62% to 30% over the arrangement that was much more prevalent half a century ago.
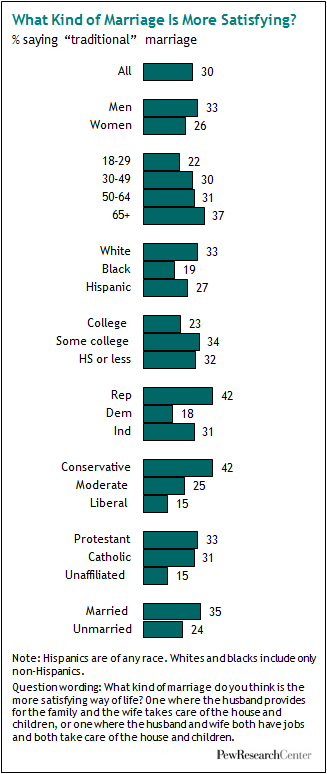
No major subgroup of survey respondents favors the older model, but some are more disposed that way than others. For example, 42% of self-described conservatives, 42% of Republicans and 37% of adults ages 65 and older say the traditional arrangement will lead to more satisfying lives.
Also, slightly more men (33%) than women (26%) feel this way. And the married (35%) are more inclined than the unmarried (24%) to say this.
Despite the public’s strong preference for the two-earner/shared homemaker marriage, the public hasn’t fully abandoned the idea that men and women play different roles in a marriage. Indeed, when it comes to evaluating the earning power of future mates, the public still has one standard for prospective husbands and a different one for future wives.
Asked how important it is for a man to be able to support a family financially if he wants to get married, fully 67% of the public say it is “very important.” But when the same question is asked about a woman, just 33% say it is very important.
There are some differences by gender in these responses, but they do not alter the basic pattern. Among male respondents, 70% say a man who is about to marry must be able to support a family, while just 27% say the same about a woman. Among female respondents, 64% say that about a man and 39% about a woman.
Race and Marriage
There are larger differences on this question by race. Fully 88% of black respondents (compared with 62% of whites and 77% of Hispanics) say that in order to be ready for marriage, a man must be able to support a family financially. Likewise, 50% of black respondents (compared with 47% of Hispanics and 28% of whites) say that a woman must be able to support a family financially in order to be ready for marriage.
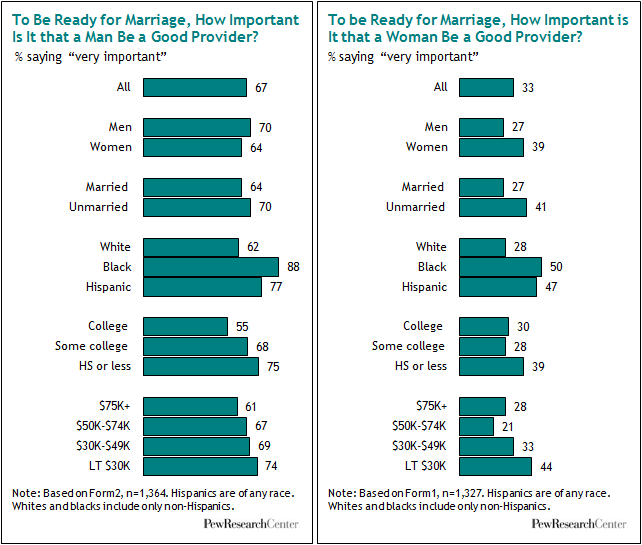
In short, blacks are the racial group most inclined to consider financial security a prerequisite to marriage. But, owing to their relatively low median income, many blacks do not meet that bar.
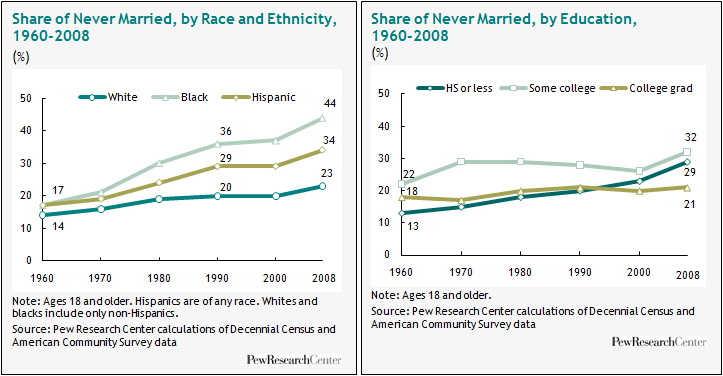
The rates of marriage in the black community reflect this mismatch. Fewer than one-third of adult blacks (32%) are currently married, compared with half of Hispanics and 56% of whites, according to Census Bureau data. On the flip side, 44% of blacks have never been married, compared with only 23% of whites. The racial marriage gap did not used to be this wide. In 1960, 17% of adult blacks and 14% of adult whites were never married—a gap of just 3 percentage points.
A similar pattern applies to education and marriage. College graduates are more likely than those without a college degree to be married these days (64% vs. around 50%). Looking at the share of those who have never married, about one-third (32%) of adults with some college education and 29% of those with a high school education or less have never married, compared with just 21% of adults with a college education. Half a century ago, the reverse was true: college graduates were more likely than adults with a high school diploma or less to have never been married (18% vs.13%).
What Makes a Good Partner?
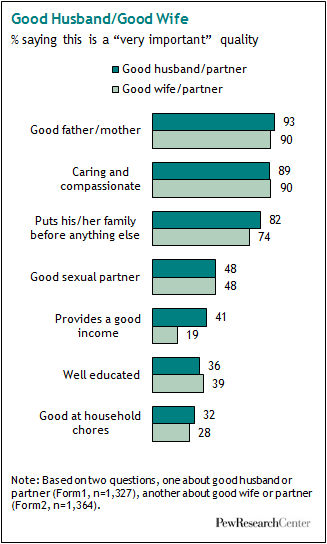
When survey respondents were asked to evaluate a battery of traits that make for a good spouse or partner, “provides a good income” was the only characteristic that generated large differences depending on whether the inquiry was about a husband or a wife.
Overall, these responses are more notable for how closely the public’s evaluations of the two gender roles are aligned. For both husbands (or male partners) and wives (or female partners), the three qualities most widely cited as being “very important” are being a good parent, being caring and compassionate, and putting one’s family before anything else. Nearly three-quarters or more say each of these traits is very important to being a good spouse or partner.
Next comes being a good sexual partner; nearly half of Americans (48%) think this is a very important quality for a good partner, be it a husband or a wife.
The public has very different evaluations for husbands and wives when it comes to providing a good income. About four-in-ten adults (41%) think this is a very important quality for a good husband or partner, compared with less than half that share (19%) who think this quality is very important for a good wife.
Of all the traits tested, being good at household chores ranks among the lowest in importance. Only about three-in-ten respondents say this is very important for a man (32%) or a woman (28%).
Men and women largely agree on the most important qualities in a spouse, be it male or female. But there are significant differences by race.
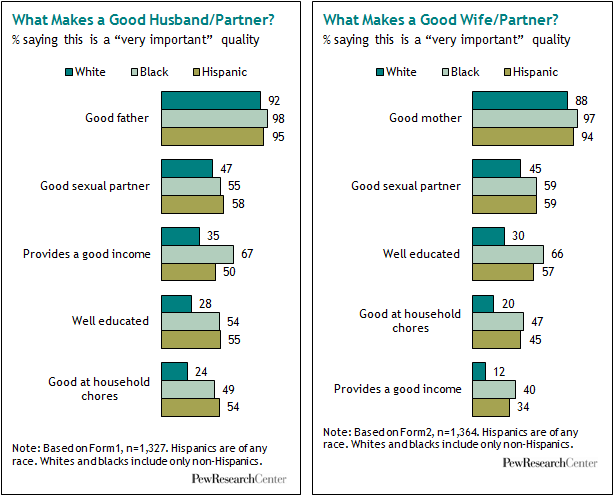
On most of the traits tested, blacks and Hispanics are more disposed than whites to say the characteristic is “very important.” On several traits, these differences are substantial. For example, blacks and Hispanics are roughly twice as likely as whites to say it is very important that a spouse (be it a man or a woman) be well educated, be good at household chores and provide a good income (at least for a woman). Minorities are also more inclined than whites to say it is very important that a spouse be a good sexual partner, and blacks are slightly more likely to say it is very important for a spouse to be a good parent.
Education matters somewhat in people’s views about what makes a good partner, although its impact is different depending on whether the spouse is a husband or a wife. Those with a high school education or less are more likely than college graduates to view “provides a good income” (51% vs. 28%) and “good at household chores” (42% vs. 22%) as very important for a good husband. On the list of qualities for a good wife, people with less education are more likely than others to say it is important that she put her family before anything else, be good at household chores and provide a good income.
Love and Marriage
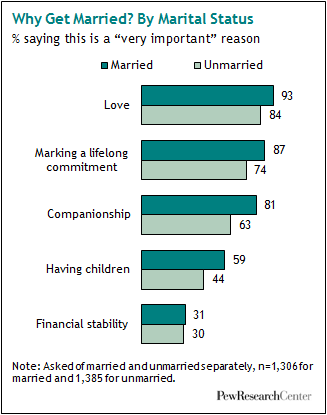
Love is the leading reason people cite for getting married—and this is true both among those who are married (93% say it is very important) and those who aren’t (84% say the same).
A majority of the public also considers several other traits to be very important, but when respondents who answered “very important” to more than one trait were asked to state the most important reason for marriage, a majority (54%) said love, followed by making a lifelong commitment (21%), companionship (11%), having children (5%) and financial stability (2%).
There are differences by income, education, race, gender and family status in many of these evaluations. For example, people with less education and lower income are more likely to view “financial stability” as a very important reason for getting married or being married. About four-in-ten people (38%) with a high school education or less say financial stability is very important, compared with 21% of college graduates and 29% of those with some college education. Similarly, 41% of those whose family income is less than $30,000 a year say that financial stability is very important, compared with 32% of whose family income is between $30,000 and $49,999, and about one-quarter of those whose family income is $50,000 a year or higher.
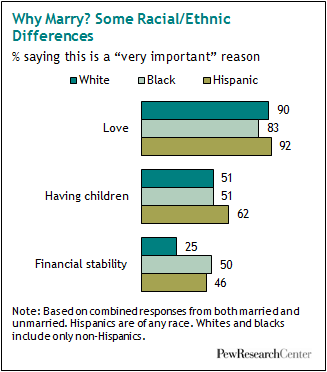
Race and ethnicity also play a role in what people value in a marriage. Whites and Hispanics are somewhat more likely than blacks to say love is a very important reason to get married. Hispanics are more likely than the other two groups to say that having children is very important (62% vs. 51%). And while half of blacks and 46% of Hispanics say that financial stability is a very important reason to marry, only a quarter of whites say the same.
Among the currently unmarried, those who are divorced or separated put more emphasis on “making a lifelong commitment” and “financial stability” than do singles or those who live with a partner. Eight-in-ten divorcees think making a lifelong commitment is a very important reason to get married, compared with about seven-in-ten in the other two groups. In addition, nearly four-in-ten divorcees (37%) view financial stability as a very important reason for getting married, compared with 22% of those who live with a partner and 27% of singles.
Men and women differ only slightly in these evaluations. Men are somewhat more likely than women to view companionship as very important to marriage (76% vs. 69%). They are also more likely than women to say that financial stability is a very important reason to get married (34% vs. 28%).
Married or Single — Which Is Better?
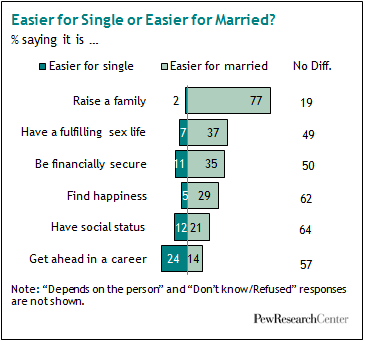
A majority of the public thinks that in many realms of life, it doesn’t make any difference if a person is married or single. About six-in-ten say this about having social status (64%), finding happiness (62%) and getting ahead in a career (57%). About half of the public thinks that it doesn’t make a difference to being financially secure (50%) or having a fulfilling sex life (49%). The one area where the public finds a big difference is raising a family: 77% think it is easier for a married person to raise a family, while just 2% say it is easier for a single person to do so, and 19% say it doesn’t make a difference.
Among the minority who say marital status does make a difference, most think being married is preferable for all realms, except for getting ahead in a career. On this question, people say being single is preferable, 24% to 14%.
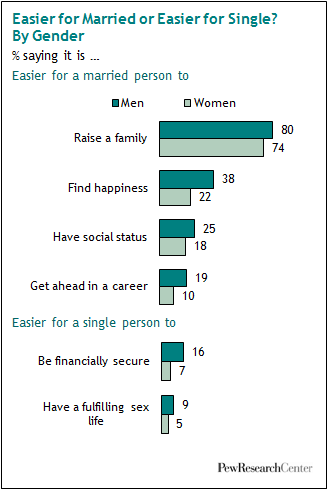
There are some gender differences in views on these questions. Men are much more likely than women to say that it is easier for a married person to find happiness (38% vs. 22%). Men are also more likely than women to say it is easier for a married person to raise a family (80% vs. 74%), have social status (25% vs. 18%) and get ahead in a career (19% vs. 10%).
Men are also more likely than women to say that it is easier for a single person to be financially secure (16% vs. 7%) and have a fulfilling sex life (9% vs. 5%). Note that except for raising a family, the differences cited here are based on the views held by a minority of each gender. The majority of both men and women say there is no difference between being married or single in most of the realms tested.
Marital experience also makes a difference in these judgments. People who are currently married or who have ever been married say it is easier for a married person in five of the six realms tested.
Adults who have never been married say being single is preferable to being married when it comes to getting ahead in a career (32% vs. 9%). Other differences are minimal. In fact, the never married are more likely than the ever married to say that marital status makes no difference to having a fulfilling sexual life (57% vs. 47%) or to finding happiness (69% vs. 59%). They are also more likely than the ever married to say being single or married doesn’t make a difference in raising a family (27% vs. 16%).
Race Some 82% of whites say it is easier for a married person to raise a family, compared with 64% of blacks and 68% of Hispanics. The two minority groups are more likely than whites to say that when it comes to raising a family, it doesn’t matter if you are single or married.
Whites are more inclined than blacks to say it is easier for a married person to be financially secure (37% vs. 30%), find happiness (32% vs. 21%) and have social status (23% vs. 16%). Though the shares are small, more blacks than whites say it is easier for a single person to find happiness (10% vs. 3%) and have social status (15% vs. 9%). Hispanics are the most likely of any racial or ethnic group to say it is easier for a single person to be financially secure (18%), compared with 9% of whites and 11% of blacks.
AgeThe advantages of being married versus being single are viewed somewhat differently by people of different ages, especially in three areas: getting ahead in a career, having social status and having a fulfilling sex life. Younger people are more likely to say these aspirations are easier to fulfill for a single person, while older people are more likely to say it is easier for a married person to achieve these goals. For example, about one-third of 18- to 29-year-olds (34%) say it is easier for a single person to get ahead in a career, while just 13% of those ages 65 and older agree.
To Marry or Not to Marry?
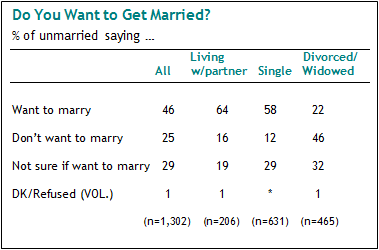
Among all currently unmarried adults, about half (46%) want to get married, 29% are not sure and 25% don’t want to marry.
But these shares change markedly depending on the circumstances of the unmarried. The desire to marry is much more prevalent among those who are single (58%) and those who are living with a partner (64%) than it is among those who are divorced20 (29%) or widowed (8%).
Having children makes a difference, too. Unmarried adults who do not have children are more likely than those who have children to say they want to get married (58% vs. 35%). There are also differences among unmarried parents: Only 27% of divorced parents want to get married, compared with nearly six-in-ten of cohabiting parents and 56% of single (never-married) parents.
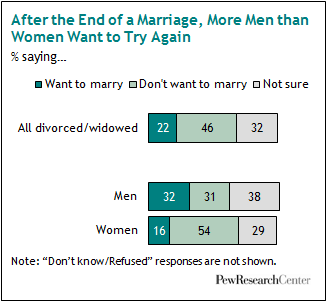
Regardless of whether they are divorced or widowed, men are more likely than women to say that they want to get married again. About one-third (32%) of divorced or widowed men say this, twice the share of their female counterparts (16%).
The youngest generation has the strongest desire to marry, a reflection of their stage in the life cycle. About seven-in-ten (69%) unmarried 18- to 29-year-olds say that they want to get married, compared with 44% of those who are ages 30 to 49, 31% of those who are 50 to 64 and 6% of those who are 65 or older. There are no significant gender differences in marriage intention among the Millennial generation (18- to 29-year-olds).
Geographic region matters to marriage intention. The unmarried (never married or cohabiters) living in the South are most likely to say they want to get married (71%), compared with people who live in the East (49%), the West (53%) and the Midwest (60%).
How Close Are Today’s Marriages?
Human beings have been known on occasion to view the past through rose-colored glasses. But this survey found no tendencies of that sort when respondents were asked to compare their own relationship with that of their parents.
About half (51%) of all respondents who are married or cohabiting with a partner say their relationship is closer than that of their parents, while 43% say it is about the same and only 5% say it is less close.
Married respondents compare their relationship somewhat more favorably with that of their parents (52% closer; 4% less close) than do cohabiting respondents (43% closer; 13% less close).
Not surprisingly, even bigger differences emerge when controlling for the marital and divorce history of respondents’ parents. Among married or cohabiting respondents whose parents divorced, fully 76% say their relationship is closer than their parents’. Among these same respondents whose parents were married, just 46% say their relationship is closer.
More women than men (55% vs. 46%) describe their marital or cohabiting relationship as closer than that of their parents.
Divorce
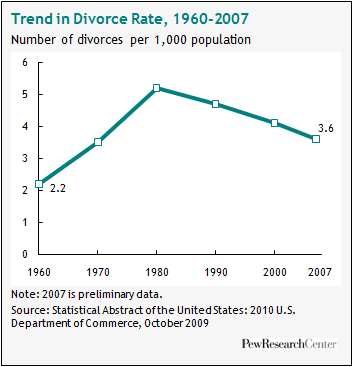
The declining share of Americans who are currently married is fueled in large part by two big trends: the rise in the median age of first marriage and the increased prevalence of divorce. While the spike in divorce is commonly associated with the turbulent decades of the 1960s and 1970s, divorce rates in this country rose more or less steadily from 1860 to 1950. This trend was reversed only temporarily during the 1950s. Then after 1960, divorce rates rose sharply.21 The divorce rate peaked in 1979 and has declined since that time.
The reasons for the sharp increase in the divorce rate in the 1960s and 1970s have been the source of great debate. Some scholars attribute it, at least in part, to the changing role of women (including women’s participation in the labor force), the sexual revolution and the rise of no fault divorces.22
There are various ways of measuring the rate of divorce. One standard approach is to look at the number of divorces per 1,000 people. Using this measure, some of the falloff in divorce from 1980 to the present reflects the simultaneous decline in marriage. Another way to look at divorce is as a share of marriages. And yet another way is to look at the likelihood of divorce by age cohort. Using either of these measures, we see an increase in the rate of divorce beginning in 1960 and a decline in the number of divorces from 1980 onward.
Divorce is never a happy option, but most Americans believe it is sometimes the only answer. In a 2007 Pew Research Center survey, 58% of the public said divorce is preferable to maintaining an unhappy marriage; 38% said divorce should be avoided except in extreme situations. An even bigger majority said divorce is sometimes the best solution when children are involved. Two-thirds (67%) said in a marriage where the parents are very unhappy with each other, the children are better off if their parents get divorced. Only 19% said the children are better off if the parents stay together.
Only One True Love?
Throughout human history, romantics, poets, balladeers and songwriters have celebrated the idea that there’s just one true love for every living soul. Do everyday Americans agree?
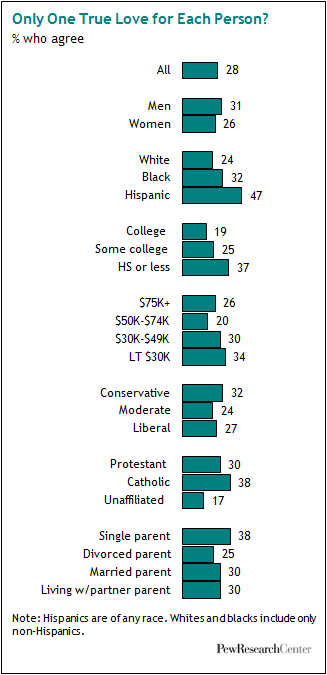
Well, 28% do. But 69% do not.
Views about one true love do not correlate with marital status or with age.
However, men (31%) are a bit more likely than women (26%) to say that every person has only one true love; and Hispanics (47%) and blacks (32%) are more likely than whites (24%) to feel this way.
Education matters, too: those with a college degree are only half as likely as those with a high school diploma or less to say everyone has just one true love (19% vs. 37%).
Conservatives (32%) are more likely to say this than moderates (24%). Catholics (38%) are more likely than Protestants (30%) or those who are unaffiliated (17%) to say they believe in just one true love.
The Pew Research survey posed a follow-up question to the respondents who say they believe in just one true love: “And have your found yours, or not?” Nearly eight-in-ten (79%) say they have. These responses correlate both with age and marriage.
Among those who say there’s only one true love for each person, about half of 18- to 29-year-olds say they’ve found theirs (54%), compared with nine-in-ten adults ages 50 and older.
Meantime, fully 96% of married adults who believe in only one true love say they’ve found theirs, compared with 61% of all unmarried adults and 79% of cohabiters.


