
People in many European nations see the European Union more favorably than they did in 2016, when United Kingdom citizens voted to withdraw from the EU.

| Date | Label | Favorable | Unfavorable |
|---|---|---|---|
| 2026 | Spring 2026 | 62 | 36 |
| 2025 | Spring 2025 | 63 | 35 |
| 2024 | Spring 2024 | 62 | 37 |
| 2023 | Spring 2023 | 68 | 31 |
| 2022 | Spring 2022 | 71 | 27 |
| 2021 | Spring 2021 | 65 | 33 |
| 2019 | Spring 2019 | 62 | 36 |
| 2018 | Spring 2018 | 62 | 36 |
| 2017 | Spring 2017 | 60 | 37 |
| 2016 | Spring 2016 | 49 | 48 |
For several years, Pew Research Center has consistently surveyed the U.K. and seven EU member nations: France, Germany, Greece, Italy, the Netherlands, Spain and Sweden. In these countries, a median of 49% of adults viewed the EU favorably in 2016. Positive ratings ranged from 27% in Greece to 58% in Italy.
A year after the Brexit vote, opinions of the EU improved sharply in most countries. Overall, a median of 60% expressed a positive view. In the U.K., the share of people who viewed the EU favorably grew from 45% in 2016 to 54% in 2017. There were even larger increases in favorability – 18 percentage points – in France and Germany.
Shortly after Russia invaded Ukraine in 2022, favorable views of the EU approached or reached record highs in many countries.
Today, views remain positive, with a median of 62% of people across the eight countries saying they view the EU favorably. In each country, the shares who say this in 2026 are roughly similar to or higher than in 2017.
Since 2016, views of the EU have improved across the ideological spectrum in most countries. In some countries, this is particularly the case among those on the left.
For example, 45% of Swedish adults on the left had a favorable view of the EU in 2016. This share has grown to 81% in 2026. A smaller increase occurred among Swedish adults on the right (61% in 2016 vs. 76% in 2026). France, the Netherlands and Spain saw similar increases among adults on the left.
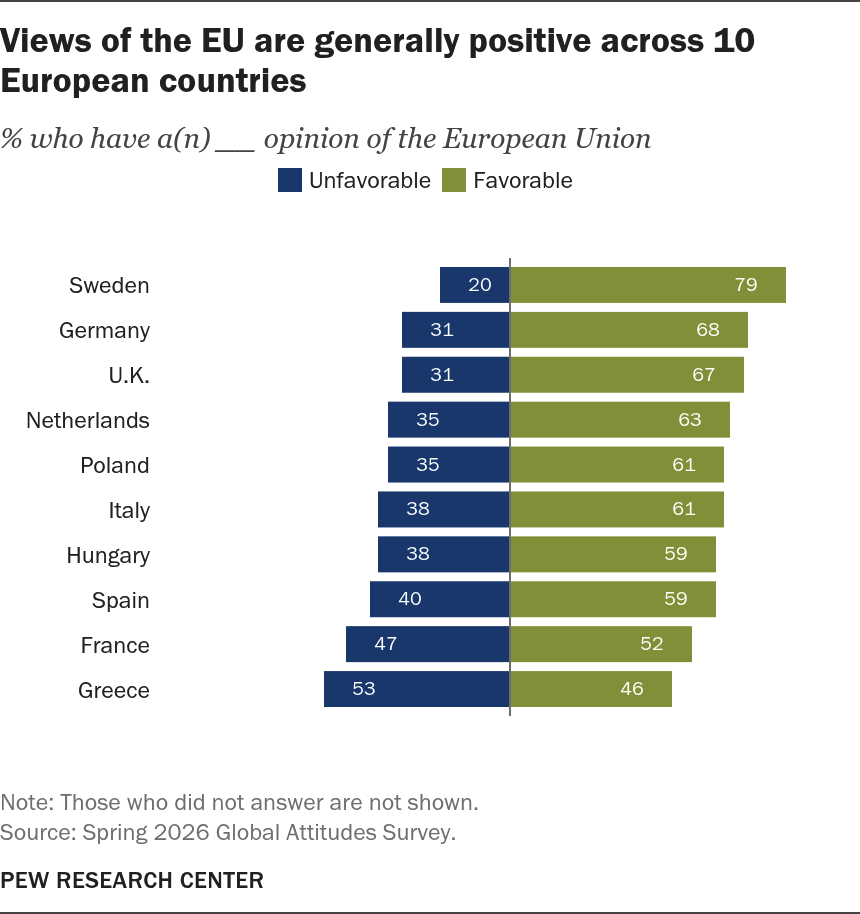
Attitudes toward the EU in 2026
| Country | Unfavorable | Favorable |
|---|---|---|
| Sweden | 20 | 79 |
| Germany | 31 | 68 |
| U.K. | 31 | 67 |
| Netherlands | 35 | 63 |
| Poland | 35 | 61 |
| Italy | 38 | 61 |
| Hungary | 38 | 59 |
| Spain | 40 | 59 |
| France | 47 | 52 |
| Greece | 53 | 46 |
In addition to the eight European countries the Center has surveyed over time, we surveyed in Hungary and Poland this year. Majorities in eight of the 10 countries currently have a positive opinion of the EU. Ratings are especially high in Sweden, where 79% hold this view. In Greece and France, opinions are more divided.
Though the U.K. is no longer a member of the EU, 67% of adults there still view the organization positively.
How views of the EU vary by ideology
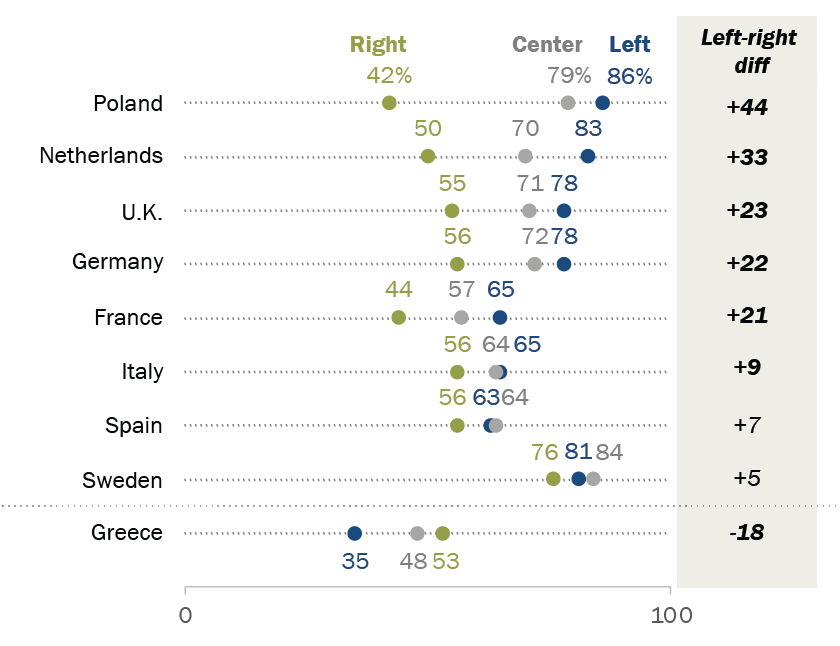
In many countries, people on the ideological left are significantly more likely than those on the right to rate the EU favorably.
| Country | Left | Center | Right | Left-Right diff |
|---|---|---|---|---|
| Poland | 86 | 79 | 42 | 44 |
| Netherlands | 83 | 70 | 50 | 33 |
| U.K. | 78 | 71 | 55 | 23 |
| Germany | 78 | 72 | 56 | 22 |
| France | 65 | 57 | 44 | 21 |
| Italy | 65 | 64 | 56 | 9 |
| Spain | 63 | 64 | 56 | 7 |
| Sweden | 81 | 84 | 76 | 5 |
| Greece | 35 | 48 | 53 | -18 |
The widest gap is 44 percentage points in Poland. Poles on the left are twice as likely as Poles on the right to view the EU positively (86% vs. 42%).
Since 2016, there has been a persistent ideological divide among Britons about the EU. It peaked at 43 points in 2017 and stands at a 23-point difference today. Currently, 78% of Britons on the left hold a favorable view of the EU, compared with 55% of those on the right.
In nearly every country surveyed, people who have a favorable view of their country’s right-wing populist party are less likely to view the EU positively. For example:
- In Hungary, those with favorable views of Fidesz are 51 percentage points less likely than non-supporters to view the EU favorably (31% vs. 82%).
- In the U.K., those who support Reform UK (formerly the Brexit Party) are 27 points less likely than those who don’t support it to view the EU favorably (49% vs. 76%).
In the four countries where we classify left-wing populist parties – France, Greece, Italy and Spain – people who have a favorable view of their country’s left-wing populist party are more likely to view the EU positively.
How views of the EU vary by age
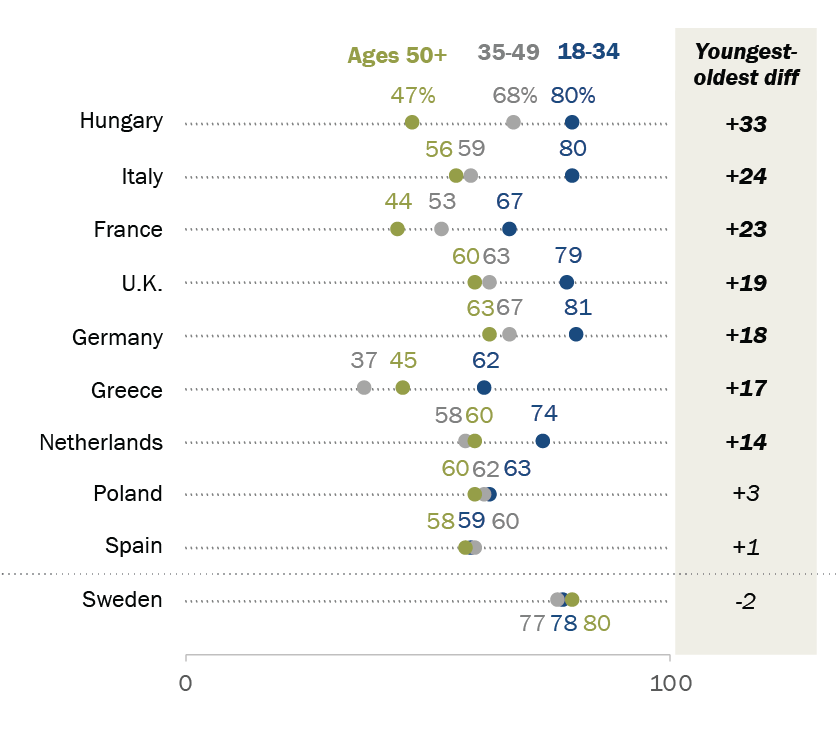
In several countries, younger adults are more likely than older adults to see the EU favorably. In Italy, 80% of adults younger than 35 rate the EU favorably, compared with 56% of adults older than 50. The pattern is similar in six other European countries.
| Country | Ages 18-34 | 35-49 | 50+ | Youngest-oldest diff |
|---|---|---|---|---|
| Hungary | 80 | 68 | 47 | 33 |
| Italy | 80 | 59 | 56 | 24 |
| France | 67 | 53 | 44 | 23 |
| U.K. | 79 | 63 | 60 | 19 |
| Germany | 81 | 67 | 63 | 18 |
| Greece | 62 | 37 | 45 | 17 |
| Netherlands | 74 | 58 | 60 | 14 |
| Poland | 63 | 62 | 60 | 3 |
| Spain | 59 | 60 | 58 | 1 |
| Sweden | 78 | 77 | 80 | -2 |
How Americans view the EU
| Unfavorable | Favorable | Grouping | |
|---|---|---|---|
| U.S. adults | 38 | 59 | U.S. adults |
| Rep/Lean Rep | 55 | 43 | Rep |
| Ages 18-49 | 50 | 48 | Rep |
| 50+ | 61 | 37 | Rep |
| Dem/Lean Dem | 20 | 77 | Dem |
| Ages 18-49 | 24 | 74 | Dem |
| 50+ | 16 | 82 | Dem |
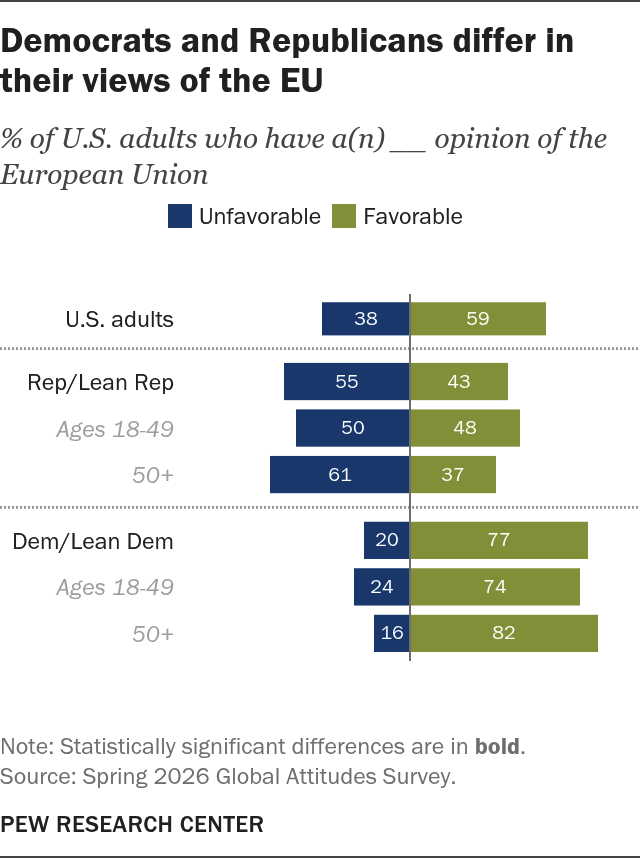
A majority of U.S. adults (59%) also have a favorable opinion of the EU. That share has been consistent in recent years.
Democrats and Democrat-leaning independents are more likely than Republicans and Republican-leaners to view the organization favorably (77% vs. 43%).
However, views differ even among partisans. Younger Republicans are more likely than older ones to hold a favorable view of the EU (48% vs. 37%). But younger Democrats are less likely than older Democrats to do so (74% vs. 82%).
Note: Here is the survey question we used for this analysis, along with responses and the survey methodology.