
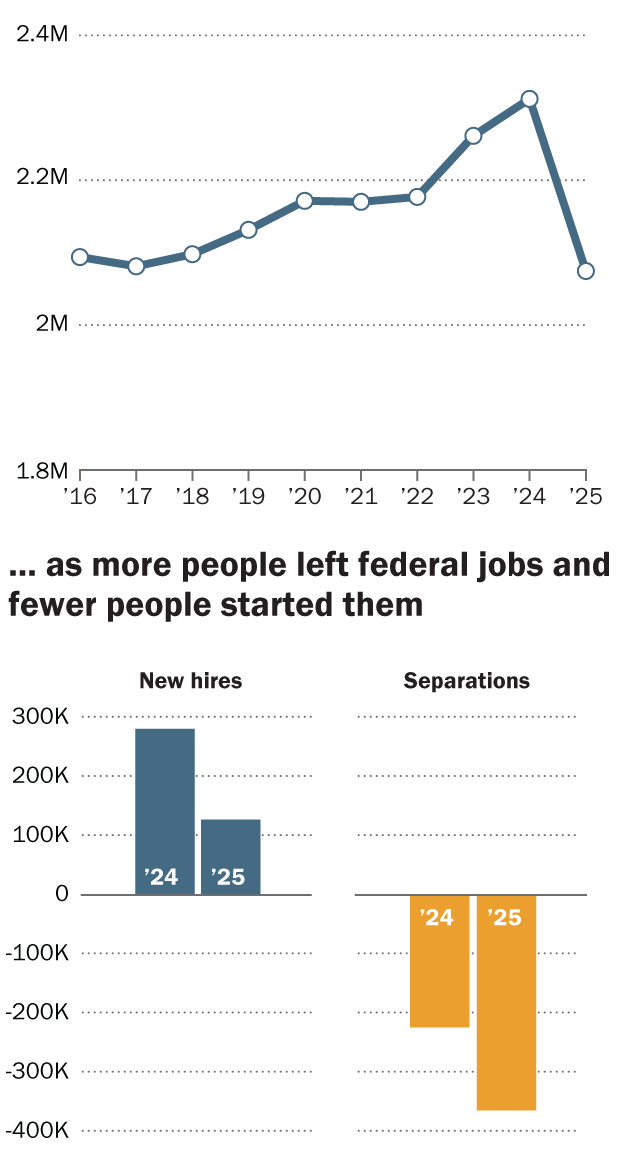
The federal workforce shrank by 10.3% in 2025, or a net of nearly 238,000 workers, according to a Pew Research Center analysis of recently published government data.
| Year | Federal workers | New hires | Separations |
|---|---|---|---|
| 2016 | 2093868 | ||
| 2017 | 2081160 | ||
| 2018 | 2097881 | ||
| 2019 | 2131465 | ||
| 2020 | 2171513 | ||
| 2021 | 2170157 | ||
| 2022 | 2176983 | ||
| 2023 | 2261282 | ||
| 2024 | 2312301 | 263433 | -192562 |
| 2025 | 2074649 | 116912 | -348219 |
A total of 348,219 people quit, retired, were laid off or otherwise left federal employment last year – an 80.8% increase from 2024. At the same time, 116,912 people started working for the federal government – a 55.6% decrease from the year before.
The job losses affected a broad swath of federal workers, with few noteworthy distinctions among people of different educational attainment, length of federal service and type of appointment (that is, the competitive civil service or otherwise).
However, the Trump administration’s job cuts disproportionately affected younger and less experienced federal workers.
People younger than 35 made up 18% of the federal workforce at the end of 2024, but that figure had slipped to 16.8% by the end of 2025. And workers with less than two years of experience – most of whom would still have been on probation and without full civil service protections – fell from 16.2% of the federal workforce to 10.3%.
The Office of Personnel Management, the federal government’s human resources department, no longer publishes data on the gender, race, ethnicity or disability status of federal workers. This information was available when we performed a similar analysis in January 2025.
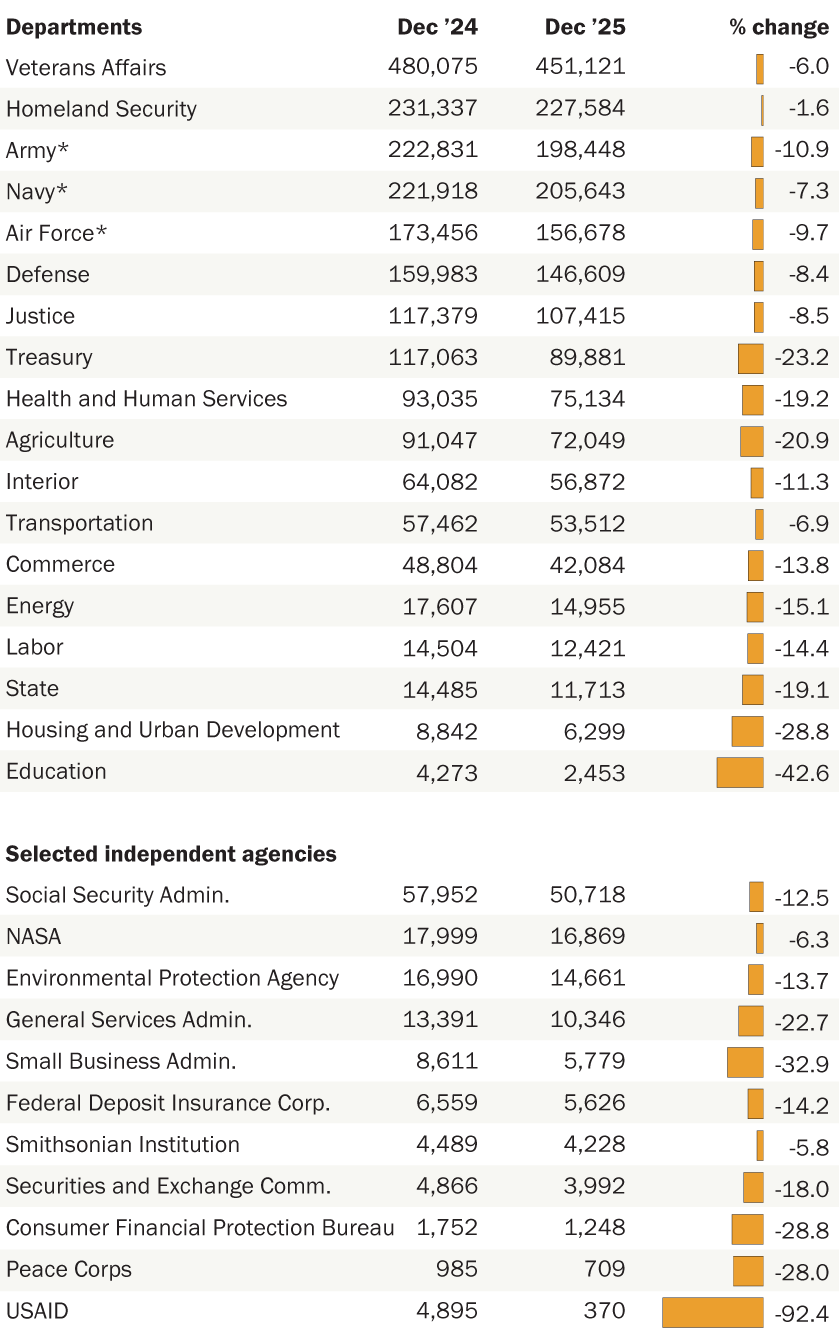
Which federal agencies saw the biggest decreases in workers?
Among major agencies, the Education Department and the U.S. Agency for International Development (USAID) – two of President Donald Trump’s earliest and most frequent targets – had the steepest job cuts.
| Department/Agency | Group | Dec 2024 | Dec 2025 | % change |
|---|---|---|---|---|
| Veterans Affairs | Dept | 480075 | 451121 | -6.0% |
| Homeland Security | Dept | 231337 | 227584 | -1.6% |
| Army* | Dept | 222831 | 198448 | -10.9% |
| Navy* | Dept | 221918 | 205643 | -7.3% |
| Air Force* | Dept | 173456 | 156678 | -9.7% |
| Defense | Dept | 159983 | 146609 | -8.4% |
| Justice | Dept | 117379 | 107415 | -8.5% |
| Treasury | Dept | 117063 | 89881 | -23.2% |
| Health and Human Services | Dept | 93035 | 75134 | -19.2% |
| Agriculture | Dept | 91047 | 72049 | -20.9% |
| Interior | Dept | 64082 | 56872 | -11.3% |
| Transportation | Dept | 57462 | 53512 | -6.9% |
| Commerce | Dept | 48804 | 42084 | -13.8% |
| Energy | Dept | 17607 | 14955 | -15.1% |
| Labor | Dept | 14504 | 12421 | -14.4% |
| State | Dept | 14485 | 11713 | -19.1% |
| Housing and Urban Development | Dept | 8842 | 6299 | -28.8% |
| Education | Dept | 4273 | 2453 | -42.6% |
| Social Security Administration | Agencies | 57952 | 50718 | -12.5% |
| National Aeronautics and Space Administration | Agencies | 17999 | 16869 | -6.3% |
| Environmental Protection Agency | Agencies | 16990 | 14661 | -13.7% |
| General Services Administration | Agencies | 13391 | 10346 | -22.7% |
| Small Business Administration | Agencies | 8611 | 5779 | -32.9% |
| Federal Deposit Insurance Corporation | Agencies | 6559 | 5626 | -14.2% |
| Smithsonian Institution | Agencies | 4489 | 4228 | -5.8% |
| Securities and Exchange Commission | Agencies | 4866 | 3992 | -18.0% |
| Consumer Financial Protection Bureau | Agencies | 1752 | 1248 | -28.8 |
| Peace Corps | Agencies | 985 | 709 | -28.0 |
| U.S. Agency for International Development | Agencies | 4895 | 370 | -92.4% |
The Education Department’s staff shrank 42.6% between December 2024 and December 2025, from nearly 4,300 employees to fewer than 2,500. And USAID was all but eliminated, going from just under 4,900 employees to 370 (-92.4%).
Related: What the data says about the U.S. Department of Education | What the data says about U.S. foreign aid
Other deep cuts came at the parent agency of the National Endowments for the Arts and the Humanities (-56.6%), AmeriCorps (-43.6%), the Small Business Administration (-32.9%), the agency that oversees Voice of America and other international broadcasters (-32.7%), and the National Science Foundation (-30.3%).
Several of the Office of Personal Management’s data categories are heavily redacted, limiting our analysis. For instance, nearly half of the December 2025 records don’t list workers’ job locations or pay.
And while the dataset covers most of the executive branch, some agencies are omitted entirely. Those include various intelligence agencies and most of the Executive Office of the President (with the notable exception of the Office of Management and Budget). The dataset doesn’t include Congress or any legislative agencies, the federal judiciary, or such quasi-independent entities as the U.S. Postal Service and the Federal Reserve.
The dataset does include the Consumer Financial Protection Bureau (CFPB), an independent agency that organizationally is part of the Federal Reserve. The CFPB’s headcount fell 28.8% last year.
Though overall headcount at the Department of Homeland Security fell slightly, that wasn’t the case at its immigration-enforcement components. Immigration and Customs Enforcement added about 7,500 workers, ending 2025 at 28,272 – a 36.1% increase – and Customs and Border Protection rose from 66,613 employees to 67,587 (up 1.5%). But most other Homeland Security components lost jobs, including the Transportation Security Administration (-4.3%), Citizenship and Immigration Services (-11.4%), and the Federal Emergency Management Agency (-14.0%).
Which occupations saw the biggest decreases?
The job cuts affected more white-collar workers, who made up 92.1% of the federal workforce at the end of 2024, than blue-collar workers. Headcount in white-collar occupations fell 10.6% last year, versus 6.7% among blue-collar occupations.
Among the larger occupational groups, some of the largest reductions were in:
- Information and arts: -20.6%
- Accounting and budget: -17.3%
- General administrative, clerical and office: -17.0%
- Business and industry: -16.4%
- Human resources management: -15.3%
One of the few white-collar occupational groups to remain stable was the “investigation” group, due largely to increases in border patrol enforcement (up 797 employees), customs and border protection (+570), and related fields, such as “general inspection, investigation, enforcement, and compliance” (+2,035). Those more than offset decreases in fields such as compliance inspection and support (down 2,177 employees), food inspection (-349), aviation safety (-141) and equal opportunity investigation (-122).
Other notable losses in specific occupations included:
- Medical workers, including nurses (-4,038), medical officers (-2,318) and practical nurses (-1,046)
- Tax professionals, including internal revenue agents (-3,141), internal revenue officers (-1,030) and tax examiners (-4,309)
- Information technology managers (-13,986)
- General attorneys (-6,608)
- Contact representatives, who explain policies and provide benefit administration to the general public (-6,629)
