
Puerto Rican singer and rapper Bad Bunny will take the stage for the Super Bowl halftime show on Feb. 8, becoming the first headliner to perform an entire set in Spanish.
Bad Bunny, who was born in Bayamón, Puerto Rico, has long honored life on the island in his music. His album “DeBÍ TiRAR MáS FOToS” – which translates to “I should have taken more photos” and reflects on his growing up in Puerto Rico – won album of the year at the 2026 Grammy Awards.
Here are answers to some key questions about Puerto Rico and Puerto Ricans, using data from the U.S. Census Bureau and other sources.
- What is Puerto Rico’s relationship with the United States?
- How many people live in Puerto Rico?
- How many Puerto Ricans live in the mainland U.S. and where?
- How do Puerto Ricans on the island differ demographically from Puerto Ricans on the mainland U.S.?
What is Puerto Rico’s relationship with the United States?
Puerto Rico – officially the Commonwealth of Puerto Rico – is one of five U.S. territories with a permanent population, along with American Samoa, Guam, the Northern Mariana Islands and the U.S. Virgin Islands. It’s located about 1,000 miles southeast of the Florida coast.
Puerto Rico was a Spanish colony for centuries before it was ceded to the U.S. in 1898 following the Spanish-American War. A 1917 act of Congress established that people born in Puerto Rico are U.S. citizens.
The island has had its own constitution since 1952 but is also subject to federal law, like U.S. states. Unlike people living in the states, Puerto Ricans living on the island can’t vote in federal elections and don’t pay federal taxes on income earned there.
Puerto Rico has some representation in Congress, but not as much as the states do. Its sole delegate in the U.S. House of Representatives, Democrat Pablo José Hernández Rivera, has limited voting privileges. The territory does not have any senators.
Since 1967, there have been seven votes on the island over whether Puerto Rico should change its political status, most recently in 2024. However, the results of these votes were nonbinding, and efforts to give Puerto Ricans a binding vote on statehood have stalled in recent Congresses.
How many people live in Puerto Rico?
| Year | Population |
|---|---|
| 1900 | 953,243 |
| 1910 | 1,118,012 |
| 1920 | 1,299,809 |
| 1930 | 1,543,913 |
| 1940 | 1,869,255 |
| 1950 | 2,210,703 |
| 1960 | 2,349,544 |
| 1970 | 2,712,033 |
| 1980 | 3,196,520 |
| 1990 | 3,522,037 |
| 2000 | 3,810,605 |
| 2001 | 3,818,774 |
| 2002 | 3,823,701 |
| 2003 | 3,826,095 |
| 2004 | 3,826,878 |
| 2005 | 3,821,362 |
| 2006 | 3,805,214 |
| 2007 | 3,782,995 |
| 2008 | 3,760,866 |
| 2009 | 3,740,410 |
| 2010 | 3,724,465 |
| 2011 | 3,693,464 |
| 2012 | 3,661,045 |
| 2013 | 3,631,427 |
| 2014 | 3,585,017 |
| 2015 | 3,535,167 |
| 2016 | 3,480,432 |
| 2017 | 3,410,837 |
| 2018 | 3,290,690 |
| 2019 | 3,302,691 |
| 2020 | 3,281,591 |
| 2021 | 3,262,731 |
| 2022 | 3,220,148 |
| 2023 | 3,203,794 |
| 2024 | 3,202,521 |
| 2025 | 3,184,835 |
As of 2025, there were about 3.2 million people living in Puerto Rico, according to U.S. Census Bureau estimates. The population is down 17% from its peak of 3.8 million in 2004, and it fell particularly fast between 2014 and 2018.
One reason for Puerto Rico’s declining population is that more people are moving from the island to the mainland U.S. – that is, to the 50 states and the District of Columbia – than to the island from the mainland. For example, in 2024, about 38,000 people on the mainland said they’d moved there from Puerto Rico in the past year, while 25,000 people in Puerto Rico said they’d moved there from the mainland.
| Year | Puerto Rico to U.S. | U.S. to Puerto Rico | Net migration out of Puerto Rico |
|---|---|---|---|
| 2005 | 47,281 | 34,372 | 12,909 |
| 2006 | 66,247 | 30,728 | 35,519 |
| 2007 | 61,085 | 27,645 | 33,440 |
| 2008 | 59,271 | 36,254 | 23,017 |
| 2009 | 61,948 | 34,567 | 27,381 |
| 2010 | 61,566 | 35,303 | 26,263 |
| 2011 | 74,986 | 19,201 | 55,785 |
| 2012 | 68,303 | 19,605 | 48,698 |
| 2013 | 76,185 | 23,554 | 52,631 |
| 2014 | 87,670 | 18,689 | 68,981 |
| 2015 | 92,572 | 23,132 | 69,440 |
| 2016 | 92,067 | 21,221 | 70,846 |
| 2017 | 92,638 | 20,991 | 71,647 |
| 2018 | 131,039 | 21,003 | 110,036 |
| 2019 | 63,623 | 31,279 | 32,344 |
| 2021 | 55,201 | 26,220 | 28,981 |
| 2022 | 42,922 | 26,177 | 16,745 |
| 2023 | 46,219 | 24,887 | 21,332 |
| 2024 | 38,486 | 25,151 | 13,335 |
The largest net migration from Puerto Rico to the mainland U.S. was reported in 2018. That year, around 110,000 more people said they’d moved from the island to the mainland than the other way around. Some of this migration came in the wake of hurricanes Irma and Maria, which struck Puerto Rico within two weeks of each other in September 2017. Almost 3,000 people died on the island, and 90% of households applied for federal assistance in the wake of the storms.
Slowing birthrates are also a factor in the island’s population decline. In 2005, about 55,200 women in Puerto Rico said they’d given birth in the previous year. By 2024, that number fell to 19,600.
Looking at the data another way, a woman living on the island in 2005 could expect to have 1.9 children in her lifetime – a statistic known as the total fertility rate. By 2024, the total fertility rate in Puerto Rico was just 1.0. That is well below the U.S. rate overall (1.6, according to United Nations data) and the global replacement-level fertility rate needed to maintain the population at a constant size (2.1).
How many Puerto Ricans live in the mainland U.S. and where?
Far more people of Puerto Rican origin live on the mainland U.S. than live on the island itself.
As of 2024, 6.1 million Puerto Ricans live in the 50 states and D.C., making them the second-largest Hispanic origin group on the mainland behind Mexicans (39 million).
Puerto Ricans make up 9% of Hispanics on the mainland, and 13% of all U.S. Hispanics, including those who live in Puerto Rico.
Most Puerto Ricans who live on the mainland (69%) were born there. Around a quarter of those on the mainland (27%) were born in Puerto Rico, and 4% were born elsewhere.
The states with the largest Puerto Rican populations are Florida (1.3 million), New York (995,000) and Pennsylvania (494,000). Puerto Ricans make up the largest share of the population in Connecticut (8.3%), followed by Florida (5.6%) and New Jersey (5.1%).
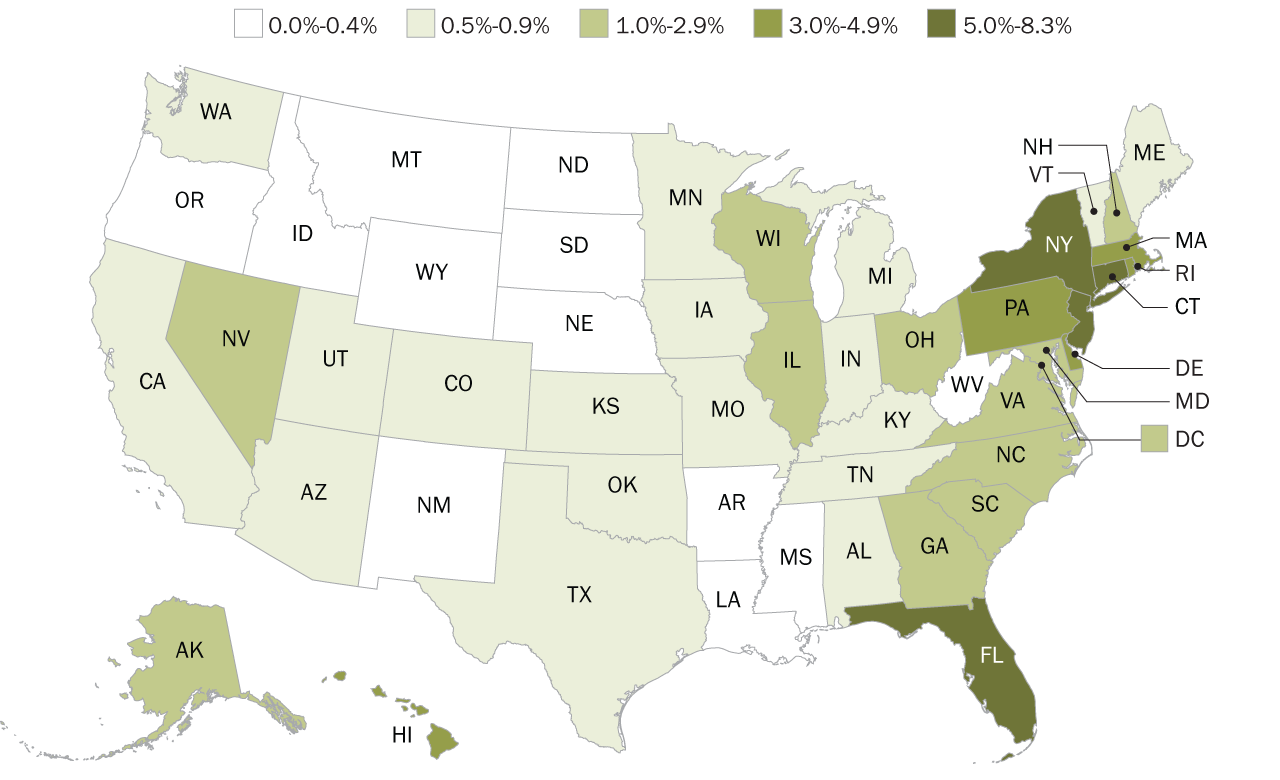
| State | FIPS | % of the population that is of Puerto Rican origin, 2024 | Category |
|---|---|---|---|
| Alabama | 01 | 0.6% | 0.6%-1.0% |
| Alaska | 02 | 1.3% | 1.1%-3.0% |
| Arizona | 04 | 0.9% | 0.6%-1.0% |
| Arkansas | 05 | 0.4% | 0.0%-0.5% |
| California | 06 | 0.5% | 0.0%-0.5% |
| Colorado | 08 | 0.8% | 0.6%-1.0% |
| Connecticut | 09 | 8.3% | 6.1%-9.0% |
| Delaware | 10 | 3.3% | 3.1%-6.0% |
| District of Columbia | 11 | 1.2% | 1.1%-3.0% |
| Florida | 12 | 5.6% | 3.1%-6.0% |
| Georgia | 13 | 1.2% | 1.1%-3.0% |
| Hawaii | 15 | 3.0% | 1.1%-3.0% |
| Idaho | 16 | 0.2% | 0.0%-0.5% |
| Illinois | 17 | 1.5% | 1.1%-3.0% |
| Indiana | 18 | 0.7% | 0.6%-1.0% |
| Iowa | 19 | 0.6% | 0.6%-1.0% |
| Kansas | 20 | 0.8% | 0.6%-1.0% |
| Kentucky | 21 | 0.6% | 0.6%-1.0% |
| Louisiana | 22 | 0.4% | 0.0%-0.5% |
| Maine | 23 | 0.6% | 0.6%-1.0% |
| Maryland | 24 | 1.2% | 1.1%-3.0% |
| Massachusetts | 25 | 4.7% | 3.1%-6.0% |
| Michigan | 26 | 0.6% | 0.6%-1.0% |
| Minnesota | 27 | 0.5% | 0.0%-0.5% |
| Mississippi | 28 | 0.3% | 0.0%-0.5% |
| Missouri | 29 | 0.5% | 0.0%-0.5% |
| Montana | 30 | 0.1% | 0.0%-0.5% |
| Nebraska | 31 | 0.3% | 0.0%-0.5% |
| Nevada | 32 | 1.1% | 1.1%-3.0% |
| New Hampshire | 33 | 1.5% | 1.1%-3.0% |
| New Jersey | 34 | 5.1% | 3.1%-6.0% |
| New Mexico | 35 | 0.4% | 0.0%-0.5% |
| New York | 36 | 5.0% | 3.1%-6.0% |
| North Carolina | 37 | 1.4% | 1.1%-3.0% |
| North Dakota | 38 | 0.2% | 0.0%-0.5% |
| Ohio | 39 | 1.3% | 1.1%-3.0% |
| Oklahoma | 40 | 0.6% | 0.6%-1.0% |
| Oregon | 41 | 0.4% | 0.0%-0.5% |
| Pennsylvania | 42 | 3.8% | 3.1%-6.0% |
| Rhode Island | 44 | 4.5% | 3.1%-6.0% |
| South Carolina | 45 | 1.1% | 1.1%-3.0% |
| South Dakota | 46 | 0.1% | 0.0%-0.5% |
| Tennessee | 47 | 0.6% | 0.6%-1.0% |
| Texas | 48 | 0.8% | 0.6%-1.0% |
| Utah | 49 | 0.5% | 0.0%-0.5% |
| Vermont | 50 | 0.7% | 0.6%-1.0% |
| Virginia | 51 | 1.3% | 1.1%-3.0% |
| Washington | 53 | 0.6% | 0.6%-1.0% |
| West Virginia | 54 | 0.3% | 0.0%-0.5% |
| Wisconsin | 55 | 1.3% | 1.1%-3.0% |
| Wyoming | 56 | 0.3% | 0.0%-0.5% |
Zooming in further, New York-Newark-Jersey City, Orlando-Kissimmee-Sanford and Philadelphia-Camden-Wilmington are the metropolitan areas with the largest Puerto Rican populations by number.
But Springfield, Massachusetts, near the Connecticut border, has a larger share of Puerto Ricans than any other metro area, at 23.2%. Orlando (13.7%) and Lakeland-Winter Haven, Florida (13.5%), round out the three metro areas with the largest shares of Puerto Ricans.
How do Puerto Ricans on the island differ demographically from Puerto Ricans on the mainland U.S.?
The average age for Puerto Ricans who live on the island is 45.0 years old as of 2024. It’s slightly higher (49.9) among those who were born on the island but now live in the 50 states and D.C. For those who were born and live on the mainland, the average age is just 26.1.
residence, 2024
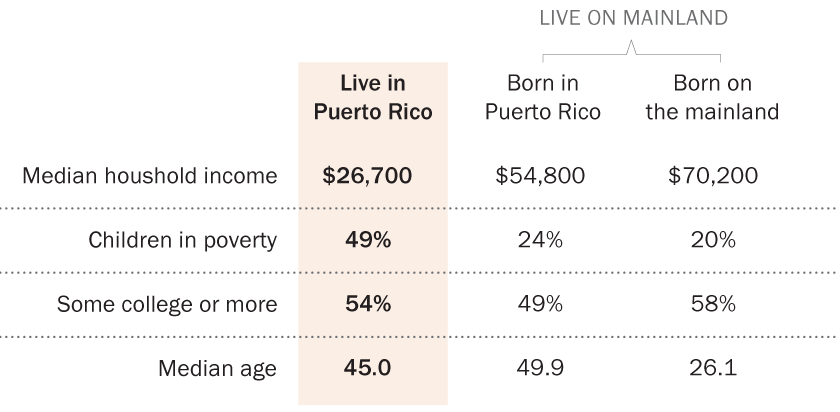
Note: “Mainland” refers to the 50 U.S. states and D.C.; “island” refers to the island of Puerto Rico. Education data is for adults ages 25 and older. Poverty status is based on the 12 months prior to the survey.
Source: Pew Research Center analysis of data from the 2024 American Community Survey (IPUMS) and 2024 Puerto Rico Community Survey.
residence, 2024
| Live in Puerto Rico | Born in Puerto Rico (Live on the mainland) | Born on the mainland (Live on the mainland) | |
|---|---|---|---|
| Median household income | $26,700 | $54,800 | $70,200 |
| Child poverty rate | 49% | 24% | 20% |
| Some college or more | 54% | 49% | 58% |
| Median age | 45.0 | 49.9 | 26.1 |
Note: “Mainland” refers to the 50 U.S. states and D.C.; “island” refers to the island of Puerto Rico. Education data is for adults ages 25 and older. Poverty status is based on the 12 months prior to the survey.
Source: Pew Research Center analysis of data from the 2024 American Community Survey (IPUMS) and 2024 Puerto Rico Community Survey.
Puerto Ricans living on the island tend to have lower incomes and higher rates of child poverty than those living on the mainland. For example, those on the island had a median household income of $26,700 in 2024. That compared with $54,800 for Puerto Ricans who were born on the island but live on the mainland and $70,200 for those who were born and live on the mainland.
There are smaller differences in educational attainment. Among Puerto Ricans ages 25 and older, 54% of those who live on the island have at least some college education. The same is true for 49% of those who were born on the island but live on the mainland and 58% of those who were born and live on the mainland.
Note: This is an update of an analysis originally published March 29, 2017. The original post was written by former Senior Writer/Editor Jens Manuel Krogstad, former Research Analyst Kelsey Jo Starr and former Senior Copy Editor Aleksandra Sandstrom.

