
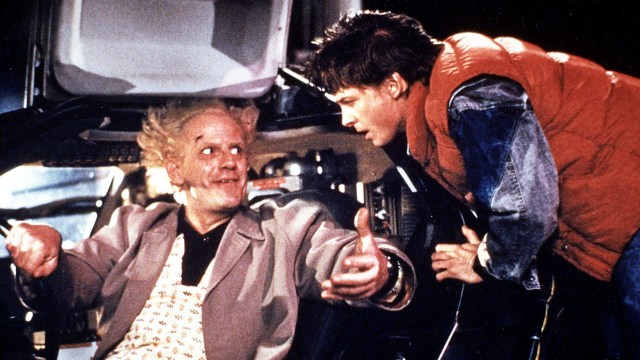
Forty years ago, “Back to the Future” premiered in theaters. The movie, about a teenager who inadvertently travels back in time, grossed around $222 million worldwide in inflation-adjusted dollars.
If you could travel through time like Marty McFly, would you go back to the past, fast-forward to the future – or stay right where you are?
In a summer 2025 survey, we asked Americans a hypothetical question about this idea:
| 50 or more years in the past | Less than 50 years in the past | In the present | Less than 50 years in the future | 50 or more years in the future | |
|---|---|---|---|---|---|
| U.S. adults | 20% | 25% | 40% | 5% | 9% |
- 45% of U.S. adults say that if they could choose, they would live sometime in the past. That includes 25% who would live less than 50 years in the past and another 20% who would live 50 or more years in the past.
- 40% of adults say they’d live in the present.
- 14% say they’d live sometime in the future. That includes 5% who would live less than 50 years in the future and 9% who would live 50 or more years in the future.
For decades, researchers have asked people questions about the past and future, including whether life today is better or worse than it used to be. In many cases, the responses tilt toward nostalgia.
Which Americans would want to live in the past?
Source: Survey of U.S. adults conducted July 8-Aug. 3, 2025.
| 50 or more years in the past | Less than 50 years in the past | Category | |
|---|---|---|---|
| All U.S. adults | 20% | 25% | All U.S. adults |
| Men | 21% | 22% | Gender |
| Women | 20% | 28% | Gender |
| White | 24% | 26% | Race/ethnicity |
| Black | 11% | 21% | Race/ethnicity |
| Hispanic | 16% | 26% | Race/ethnicity |
| Asian* | 9% | 23% | Race/ethnicity |
| Ages 18-49 | 19% | 29% | Age |
| 50+ | 22% | 21% | Age |
| Rep/Lean Rep | 27% | 25% | Party |
| Dem/Lean Dem | 14% | 26% | Party |
| Some college or less | 23% | 26% | Education |
| College grad+ | 14% | 24% | Education |
Source: Survey of U.S. adults conducted July 8-Aug. 3, 2025.
Some groups of Americans are more likely than others to say they’d like to live in the distant past – that is, 50 years ago or more. For example, 24% of White Americans say this, compared with smaller shares of adults who are Hispanic (16%), Black (11%) or Asian (9%).
Republicans and those who lean toward the GOP are about twice as likely as Democrats and Democratic leaners to say they’d choose to live in the distant past (27% vs. 14%). And Americans without a bachelor’s degree are more likely than college graduates to say this (23% vs. 14%).
The partisan differences persist even when controlling for education level and for race and ethnicity.
Men and women are equally likely to say they’d choose to live in the distant past. But women are somewhat more likely than men to say they’d choose the more recent past – that is, less than 50 years ago (28% vs. 22%).
There are also some differences by age. Adults ages 18 to 49 are more likely than those 50 and older to say they’d choose to live in the more recent past. Older adults are slightly more likely than their younger counterparts to prefer the distant past.
Which Americans would want to live in the present?
About four-in-ten Americans in most groups say they would want to live in the present if they had the choice. But those ages 65 and older (48%), those with at least a bachelor’s degree (47%) and those with upper incomes (47%) are among the most likely to say this.
Which Americans would want to live in the future?
Source: Survey of U.S. adults conducted July 8-Aug. 3, 2025.
| Less than 50 years in the future | 50 or more years in the future | Category | |
|---|---|---|---|
| All U.S. adults | 5% | 9% | All U.S. adults |
| Men | 4% | 13% | Gender |
| Women | 5% | 6% | Gender |
| White | 3% | 7% | Race/ethnicity |
| Black | 8% | 14% | Race/ethnicity |
| Hispanic | 7% | 12% | Race/ethnicity |
| Asian* | 8% | 14% | Race/ethnicity |
| Ages 18-49 | 6% | 11% | Age |
| 50+ | 4% | 7% | Age |
| Rep/Lean Rep | 3% | 6% | Party |
| Dem/Lean Dem | 7% | 12% | Party |
| Some college or less | 5% | 9% | Education |
| College grad+ | 4% | 9% | Education |
Source: Survey of U.S. adults conducted July 8-Aug. 3, 2025.
Black, Hispanic and Asian adults are more likely than White adults to say they’d choose to live in the near or distant future. For example, 14% of Black Americans, 14% of Asian Americans and 12% of Hispanic Americans say they’d choose the distant future, compared with 7% of White Americans.
Democrats are about twice as likely as Republicans to say they’d choose the near or distant future. And adults under 50 are slightly more likely than older adults to say this.
When it comes to gender, men are about twice as likely as women to say they’d choose to live in the distant future. But men and women are equally likely to say they’d choose the near future.
Which emotions do Americans feel about the future?
In the same survey, we asked Americans whether they feel any of four emotions when they think about the future: hopeful, scared, happy or sad. Their responses suggest that they’re experiencing a range of feelings:
- 68% of U.S. adults say they feel hopeful about the future.
- 60% say they feel scared.
- 54% say they feel happy.
- 50% say they feel sad.
There are also differences on this question between some groups of Americans. For example, people who say they attend religious services at least monthly are more likely than those who attend less often or never to say they feel hopeful and happy. And they’re less likely to say they feel scared and sad.
Similarly, Republicans are more likely than Democrats to say they feel hopeful and happy about the future and less likely to say they feel sad and scared. These partisan differences persist after controlling for religious service attendance and vice versa.
Answers to this question are consistent with a broader pattern we see in which partisans feel better about the present and the future when their party is in power in Washington. For example, in a 2023 survey during Democrat Joe Biden’s presidency, we asked Americans about the future trajectories of the U.S. economy, the country’s global standing and its political divides. In that survey, Republicans were more pessimistic than Democrats about each of these things.
When it comes to gender, women are more likely than men to say they feel scared and sad about the future, while men are slightly more likely than women to say they feel hopeful. Men and women are equally likely to say they feel happy when they think about the future.
Note: Research Associates Jonathan Schulman and Kirsten Lesage contributed to this analysis. Here are the questions used for this analysis, the topline and the survey methodology.
