

Note: The Center has published updated topline findings for this analysis using data from the 2020-21 school year.
Elementary and secondary public school teachers in the United States are considerably less racially and ethnically diverse as a group than their students – and while the share of Black, Hispanic and Asian American teachers has increased in recent decades, it has not kept pace with the rapid growth in the racial and ethnic diversity of their students, according to data from the National Center for Education Statistics (NCES).
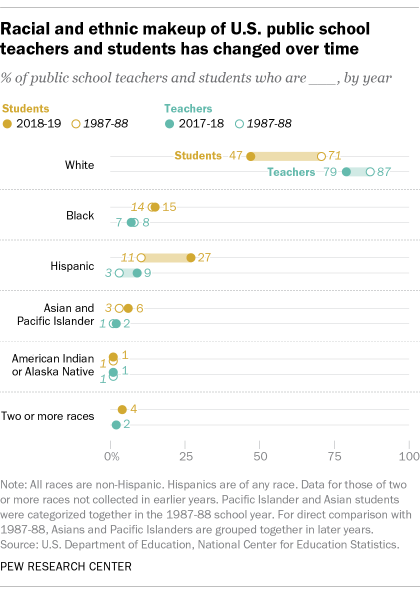
About eight-in-ten U.S. public school teachers (79%) identified as non-Hispanic White during the 2017-18 school year, the most recent year for which NCES has published demographic data about them. Fewer than one-in-ten teachers were either Black (7%), Hispanic (9%) or Asian American (2%). And fewer than 2% of teachers were either American Indian or Alaska Native, Pacific Islander, or of two or more races.
By comparison, 47% of all public elementary and secondary school students in the U.S. were White in 2018-19, according to the most recent data available. In that period, around a quarter of public school students were Hispanic (27%), 15% were Black and 5% were Asian. Those shares have increased over time as newer generations of young people entered the classroom. About 1% or fewer were Pacific Islander or identified as American Indian or Alaska Native, while 4% were of two or more races.
To assess the racial and ethnic differences in U.S. public elementary and secondary school teachers and the students they teach, this analysis uses federal data to study these two groups’ makeup and how they have changed over time.
The analysis draws on more than three decades of survey and demographic data from the National Center for Education Statistics (NCES), including the National Teacher and Principal Survey (formerly called the Schools and Staffing Survey), the Public Elementary/Secondary School Universe Survey and the Education Demographic and Geographic Estimates (EDGE).
The analysis uses the most recent data available for U.S. teachers (the 2017-18 school year) and for students (the 2018-19 school year). Data was unavailable for some states due to low response rates or unmet data collection standards.
White, Black, Asian American, Pacific Islander and American Indian or Alaska Natives in this analysis are those who report being one race and are not Hispanic. Hispanics are of any race. Due to methodological changes, earlier NCES data does not include a category for two or more races, and Asian Americans are grouped with Pacific Islanders.
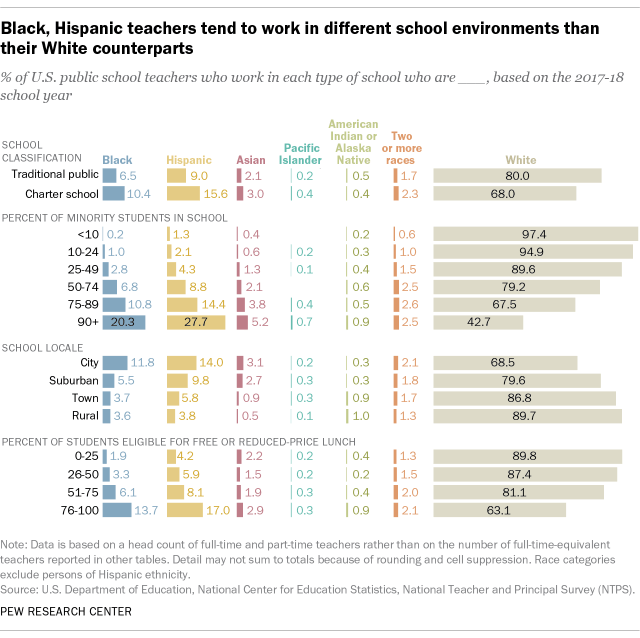
Not only do White teachers sharply outnumber educators of other races and ethnicities, but they also tend to work in different school environments, the NCES data shows:
- In schools where students come from households with lower incomes, greater shares of teachers are Black or Hispanic than at schools where students are wealthier. One measure of this is the share of students who qualify for free or reduced-price lunch, often used as a proxy measure for students in lower-income households. In schools where more than 75% of students qualify for the program, 17% of teachers are Hispanic, 14% are Black and 63% are White. At schools where 25% or fewer students qualify, 4% of teachers are Hispanic, 2% are Black and nine-in-ten are White.
- Hispanic, Black and Asian teachers also make up larger shares of the teaching force in city schools (14%, 12% and 3%, respectively) than in rural ones, where 4% are Hispanic or Black and fewer than 1% are Asian American. White teachers, on the other hand, make up 69% of urban school teachers and 90% of rural ones, reflecting the broader racial and ethnic makeup of America’s communities.
- At schools with bigger percentages of racial or ethnic minority students, larger shares of teachers were Hispanic, Black or Asian American while the reverse was true for schools with more White students. In schools where at least 90% of students were minorities, the share of teachers who were Hispanic was 28%, while 20% of teachers were Black, 5% were Asian and 43% were White. Across schools where at least 90% of students were White, nearly all teachers (97%) also were White. This is similar to the experience for students: Many students go to schools where at least half of their peers are of the same race or ethnicity.
Changes over time
The share of White teachers has decreased about 8 percentage points since the 1987-88 school year (the earliest period with comparable data), when about 87% of teachers were White. Both the number and share of Hispanic and Asian teachers grew during that time span. While the number of Black teachers also has increased since the late ’80s, they have declined as a share of teachers overall.
In the last 30 years, Hispanic teachers have overtaken Black educators as the second-largest racial or ethnic group among U.S. public school teachers. In 1987-88, there were almost three times as many Black public school teachers (191,000) as Hispanic ones (69,000). Since then, the number of Hispanic teachers increased nearly fivefold to 331,000, while the number of Black teachers increased by 25%, to 239,000.
The share of Asian public school teachers has also grown steadily. Between 1987-88 and 2017-18, the number of Asian teachers more than tripled, from 21,000 to 75,000. This happened during a time span (2000 to 2019) when Asian and Hispanic populations in the U.S. were the fastest-growing racial or ethnic groups.
Meanwhile, the pattern in racial and ethnic diversity among school principals is similar to that of teachers. In 2017-18, around eight-in-ten principals (78%) were White, compared with 11% who were Black, 9% who were Hispanic and 1% who were Asian American. This represents an increase since 1987-88, when Black, Hispanic and Asian or Pacific Islander principals accounted for 9%, 3% and less than 1% of principals, respectively.
During the same time span, growth in racial and ethnic diversity was much faster among U.S. students than among both teachers and principals. During the 1987-88 school year, 71% of American elementary and secondary school students were White, 14% were Black, 11% were Hispanic and 3% were Asian or Pacific Islander (the two categories were grouped together that year). By the 2018-19 school year, White children made up fewer than half of students (47%). Hispanic students accounted for the second-largest share at 27%, while 15% were Black, 5% were Asian American and 4% identified as multiracial.
It’s worth pointing out that U.S. public school teachers look different from students not just in terms of race and ethnicity, but also in terms of gender. The most recent data shows that roughly three-quarters of all elementary and secondary school teachers were women, while students are nearly evenly split between boys and girls.
Geographic differences
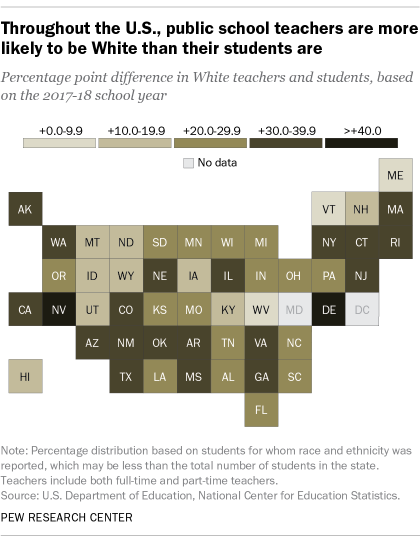
The racial and ethnic makeup of teachers varies somewhat by state, but there is no state where teachers are less likely to be White than their students, according to separate NCES data for the 2017-18 school year (again, the only recent year where data for both groups was available).
Nationally, state public school teachers are on average 27 percentage points more likely to be White than their students. In Nevada, 77% of public school teachers are White but only one-third of public school students are – a 45-point difference and the widest gap of any state. In all, White teachers make up 79% of the nation’s public school teachers and they account for that share or greater of educators in 37 states. (There is no 2017-18 NCES data available for Maryland or the District of Columbia.)
The only state where White teachers are not the largest racial or ethnic group is Hawaii, where Asian teachers are 42% of the teaching force. White teachers account for about a quarter, and Native Hawaiians or Pacific Islanders comprise 10%.
In New Mexico, 36% of teachers are Hispanic – the largest share in any state. And the largest share of Black teachers is in Georgia, where a quarter of the teaching force is Black.
