
Survey research is rapidly moving online – it’s cheaper, faster, provides greater flexibility in questionnaire design, and often has substantial advantages in data quality compared with phone surveys. Web surveys are being adopted in all sectors of the industry, from marketing to the U.S. Census Bureau’s American Community Survey to election polling.
That makes it increasingly important to assess the accuracy of these surveys. Surveys that include only those who use the internet (and are willing to take surveys online) run the risk of producing biased results. And, in fact, a notable share of Americans either cannot or will not complete a survey via the internet.
That raises two questions: Whom do you miss with a Web-only survey, and how does it affect your results?
In this instance, there was a way to get at the answers by turning to our American Trends Panel, a nationally representative group of Americans who have agreed to participate in our surveys. Most of the panel members participate via the Web, but a sizable number (representing nearly one-fifth of the public) do not. A little more than half of these non-Web participants are not online, and the rest would not provide an email address in order to be surveyed. However, we are able to survey the non-Web panel members by mail and assess how much, if at all, their non-participation would affect the outcome in a national poll conducted exclusively online.
Here are four key findings from our new report, “Coverage Error in Internet Surveys.”
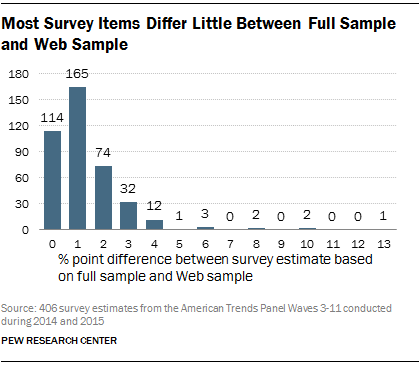
Survey results are mostly unaffected when the non-Web respondents are left out. There is little or no difference between the full (Web and mail combined) sample and Web-only sample in a majority of topics that were asked about. Only nine survey items we tested yielded a difference of 5 or more percentage points, while the other 397 (98%) of the survey items yielded a difference of 4 percentage points or less. More specifically, about two-thirds of the 406 items yielded estimates with a difference of zero or 1 point.
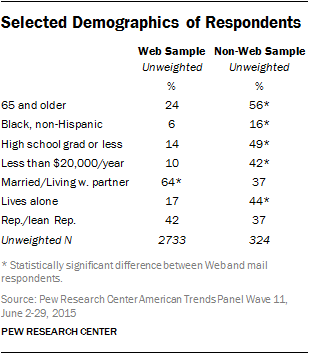
Even though the people who couldn’t or wouldn’t take the Web survey were very different from the people who did, leaving them out didn’t make a difference in the national survey results. The non-Web respondents are more than twice as likely as the Web respondents to be ages 65 and older and nearly three times as likely to be black. Non-Web respondents have lower levels of education and family income than Web respondents. They are less likely than Web respondents to be married or partnered and more likely to be living alone. There are smaller differences between Web and non-Web respondents in terms of political identity and engagement.
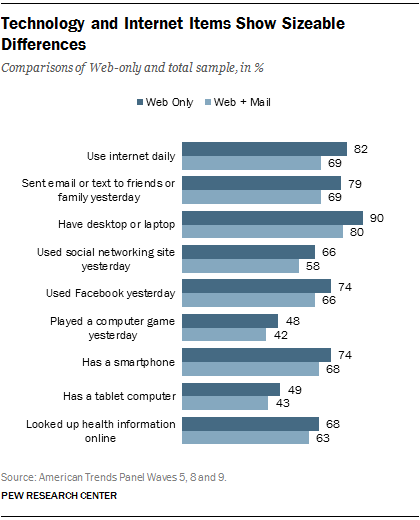
One area where there were significant differences was survey items relating to technology. The nine out of 406 survey items that have a difference of at least 5 percentage points between the full sample and the Web sample are related to internet or technology use. There is a 13-point difference in daily internet use between the Web-only sample (82%) and of the total sample (69%). About eight-in-ten of Americans in the Web-only sample said they had sent email or texts to friends or family the day before, compared with about seven-in-ten in the total sample. Fully 90% in the Web-only sample own a desktop or laptop, compared with 80% in the total sample.
Some findings among senior citizens, blacks and the less-educated showed large differences between the full sample and Web-only sample. Among adults 65 and older, the estimate of daily internet use is 35 points higher in a Web survey than the full sample (74% vs. 39%). But even some non-technology items show sizable differences. There is a 10-point difference among Americans ages 65 and older who are interested in Bible reading between the full sample and the Web-only sample. Blacks (65%) have a similar rate of employment as whites (61%) in the Web sample, but among the full sample the white employment rate is 8 points higher than among blacks (62% vs. 54%). Respondents with a high school education or less are 7 points more likely to have a driver’s license in the Web-only sample than those in the full sample.
