
Though many Americans apparently don’t realize it, the U.S. is producing considerably more of its own energy. Last year the U.S. generated a record 79.1 quadrillion Btu (British thermal units) domestically, nearly 14% more energy than in 2005, largely due to increased production of oil and natural gas.
And with the ongoing boom in “unconventional” oil and gas production, the nation is on track to produce even more energy this year. (“Unconventional” oil and gas reserves are those that cannot be extracted by drilling traditional wells; instead, advanced technologies such as horizontal drilling and hydraulic fracturing, or “fracking,” are used.)
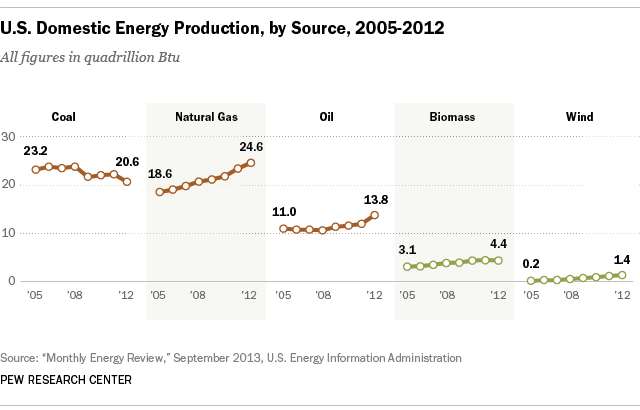
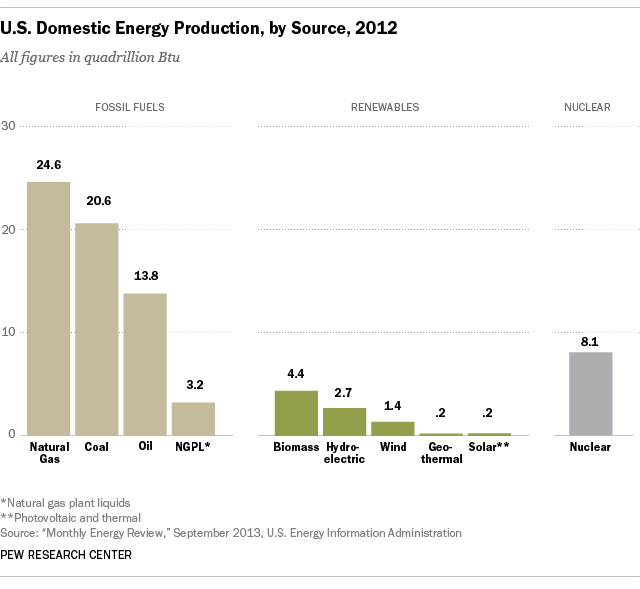
Beginning in 2011, natural gas supplanted coal as the nation’s single-biggest source of domestically produced energy, according to data from the U.S. Energy Information Administration. In the first half of this year, 11.95 trillion cubic feet of “dry” (or consumer-grade) natural gas were produced, slightly above the same period last year and 7.9% more than in the first six months of 2011.
Domestic crude oil production bottomed out in 2008 at a rate of 5 million barrels a day. But since then, production has jumped 46%, to an average rate (through August of this year) of almost 7.3 million barrels a day. Much of that increase is due to the boom in shale/tight oil production in the past few years: A 2012 discussion paper from Harvard’s Belfer Center for Science and International Affairs, for instance, projected that U.S. production capacity could increase by 3.5 million barrels per day (mbd) by 2020, to 11.6 mbd.
Coal, however, still accounted for 39% of U.S. electricity generation in the first seven months of this year, up from 36% in the same period last year, according to the EIA’s “Electric Power Monthly” report. The natural-gas share of power generation fell from 31% to 27%. Coal’s prominence raises the stakes for the Obama administration’s plans to limit carbon dioxide emissions from power plants.
The share of total U.S. energy produced from renewable sources — biomass, hydroelectric, wind, solar and geothermal — has crept higher over the past six years, responding to both government policies (from federal tax credits to state standards for electricity generators) and public pressure. The renewable share of domestic energy production grew from 7.2% in 2001 to 11.8% in the first half of this year.
Despite that growth, the vast majority of America’s domestic energy production — 78.2% as of June — still comes from fossil fuels. (Nuclear power has remained roughly flat since 1995, accounting for roughly 10% of domestic energy production.)
Overall, domestic production accounted for 83.2% of total U.S. energy consumption last year and 82.9% in the first five months of this year. Those represent the highest levels of energy self-sufficiency in two decades, though hardly the highest on record: In 1985, for example, domestic production represented 88.6% of total energy use.
The country also continues to get more out of the energy it uses. Last year, it took an average of 6,150 Btu to generate each dollar of inflation-adjusted GDP; it took 7,560 Btu ten years earlier, 9,270 Btu in 1992, and 11,270 Btu in 1982.
Bonus fact: What’s a Btu? A Btu, or British thermal unit, is the amount of energy needed to raise or lower 1 pound of water 1 degree Fahrenheit. Scientists generally use the joule as a unit of energy rather than the Btu (one Btu is about 1,055 joules), but the U.S. government continues to measure energy production and consumption in Btu.
