The world’s population expanded from 2010 to 2020, and so did most religious groups, according to a Pew Research Center analysis of more than 2,700 censuses and surveys.
Christians remained the world’s biggest religious group. But Christians (of all denominations, counted as one group) did not keep pace with global population growth from 2010 to 2020.

- The number of Christians rose by 122 million, reaching 2.3 billion.
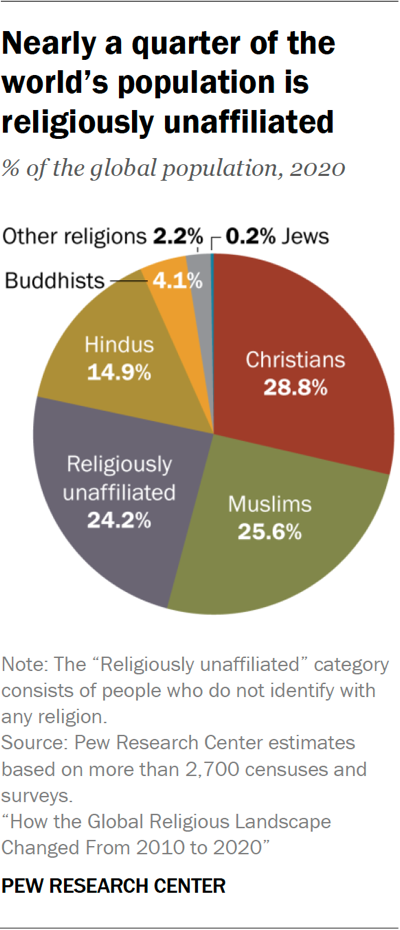
- Yet, as a share of the world’s population, Christians fell 1.8 percentage points, to 28.8%.
Muslims were the fastest-growing religious group over the decade.
- The number of Muslims increased by 347 million – more than all other religions combined.
- The share of the world’s population that is Muslim rose by 1.8 points, to 25.6%.

Buddhists were the only major religious group that had fewer people in 2020 than a decade earlier.
- The number of Buddhists worldwide dropped by 19 million, declining to 324 million.
- As a share of the global population, Buddhists slipped by 0.8 points, to 4.1%.
People with no religious affiliation – who are sometimes called “nones” – were the only category aside from Muslims that grew as a percentage of the world’s population.1
- The number of religiously unaffiliated people rose by 270 million, reaching 1.9 billion.
- The share of “nones” climbed nearly a full percentage point, to 24.2%.
Hindus grew at about the same rate as the world’s overall population.
- The number of Hindus rose by 126 million, reaching 1.2 billion.
- As a proportion of the global population, Hindus held steady at 14.9%.
Jews also held steady as a share of the world’s population.2
- The number of Jews worldwide grew by nearly 1 million, reaching 14.8 million.
- In percentage terms, Jews were the smallest group in the study, representing about 0.2% of the world’s population.
All other religions combined (including Baha’is, Daoists, Jains, Sikhs, adherents of folk religions and numerous other groups) expanded in tandem with the rest of the world. Their share of the global population held steady at 2.2%.
Collectively, 75.8% of the world’s people identified with a religion as of 2020. The remaining 24.2% did not identify with any religion, making people with no religious affiliation the third-largest group in this study, after Christians and Muslims.
Since 2010, the share of the global population that has any religious affiliation has declined by nearly 1 percentage point (from 76.7%) while the share without an affiliation has risen by the same amount (from 23.3%).
The growth of religious “nones” is striking because they are at a “demographic disadvantage” – their population is relatively old, on average, with relatively low fertility rates. However, unaffiliated people continued to grow as a share of the global population because many affiliated people around the world – primarily Christians – are “switching” out of religion.
Regional change
Between 2010 and 2020, the share of the global population living in sub-Saharan Africa increased to 14.3% (up 2 percentage points), and the share living in the Middle East-North Africa region rose to 5.6% (up 0.5 points).

Every other region held a smaller share of the world’s population in 2020 than in 2010. These shifts are reflected in the geographic distribution of some religious groups, including Christians.
Sub-Saharan Africa is now home to the largest number of Christians, surpassing Europe. As of 2020, 30.7% of the world’s Christians live in sub-Saharan Africa, compared with 22.3% in Europe. This change was fueled by differences in the two regions’ rates of natural increase (with much higher fertility rates in Africa than in Europe), as well as by widespread Christian disaffiliation in Western Europe.
The regional concentration of Jews also has changed. As of 2020, 45.9% of Jews live in the Middle East-North Africa region, while 41.2% reside in North America. In 2010, North America was the region where the largest number of Jews lived. This shift was primarily the result of Israel’s Jewish population growing from 5.8 million to 6.8 million between 2010 and 2020, through a combination of natural increase and migration.5
Changes within countries
Another way to assess religious change is to look at how many countries and territories experienced a substantial shift in their religious makeup. In this section, we focus on places where a religious group’s share of the overall population grew or shrank by at least 5 percentage points between 2010 and 2020. (For a discussion of the challenge of measuring the statistical significance of changes in religious composition, refer to the Methodology.)
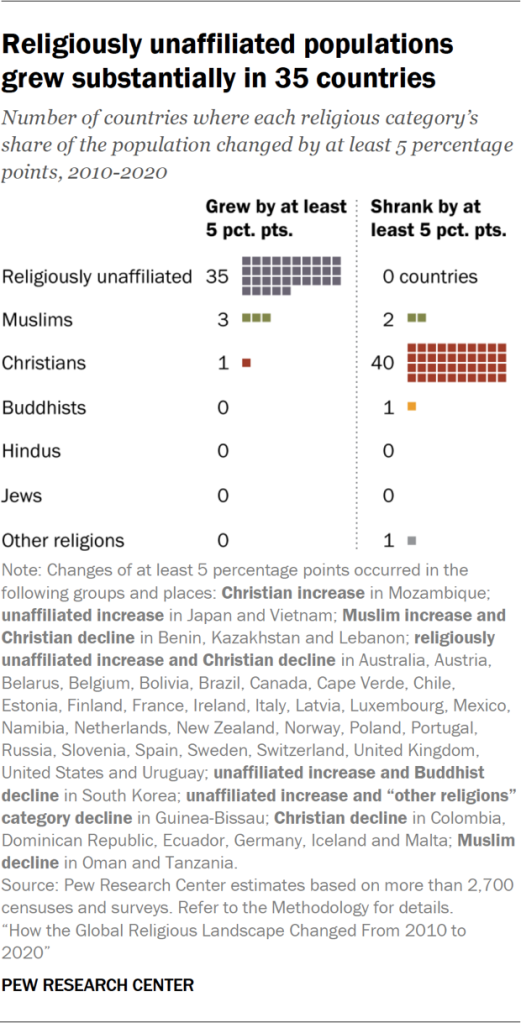
Christians experienced a substantial change, as defined above, in more countries (41) than any other religious group. In all but one case, Christians shrank as a share of the population. Most of the countries experiencing declines were in the Americas and Europe. The decreases ranged from a 5-point drop in Benin to a 14-point drop in the U.S. and a 20-point drop in Australia.
Only in Mozambique did the share of the population that is Christian grow substantially between 2010 and 2020, rising by 5 percentage points.
Few countries experienced substantial changes in the percentage of Muslims in their populations. Although the global Muslim population grew at a faster rate than any other major religion between 2010 and 2020, this was largely because of overall population growth in the countries where Muslims are concentrated. Muslim shares are estimated to have risen by at least 5 points in Kazakhstan, Benin and Lebanon, and to have dropped by at least 5 points in Tanzania and Oman.
In addition, there were declines of 7 points in the Buddhist share of South Korea’s population and in the share that people of other religions made up of Guinea-Bissau’s population.
Religiously unaffiliated people experienced the largest number of substantial increases. People of no religion gained at least 5 percentage points in 35 countries spread across the globe. The unaffiliated grew the most (as a share of each country’s total population) in the U.S. (up 13 points), Uruguay (up 16 points), Chile (up 17 points) and Australia (up 17 points).
The United States, as of 2020, is the country with the world’s second-largest number of religiously unaffiliated people (after China), surpassing Japan.

The U.S. had roughly 101 million religious “nones” in 2020 (up 97% from a decade earlier), while Japan had 73 million (up 8%). However, the unaffiliated category continues to account for a much larger share of the total population in Japan – 57% of all Japanese are religiously unaffiliated – than in the U.S., where 30% identify as atheist, agnostic or “nothing in particular.”
In both 2010 and 2020, China had more religiously unaffiliated people than any other country. China’s 1.3 billion unaffiliated people made up 90% of its total population in 2020.6
Most countries still have Christian majorities
Due to disaffiliation from Christianity, there now are fewer Christian-majority countries and more countries with a religiously unaffiliated majority than there were in 2010.
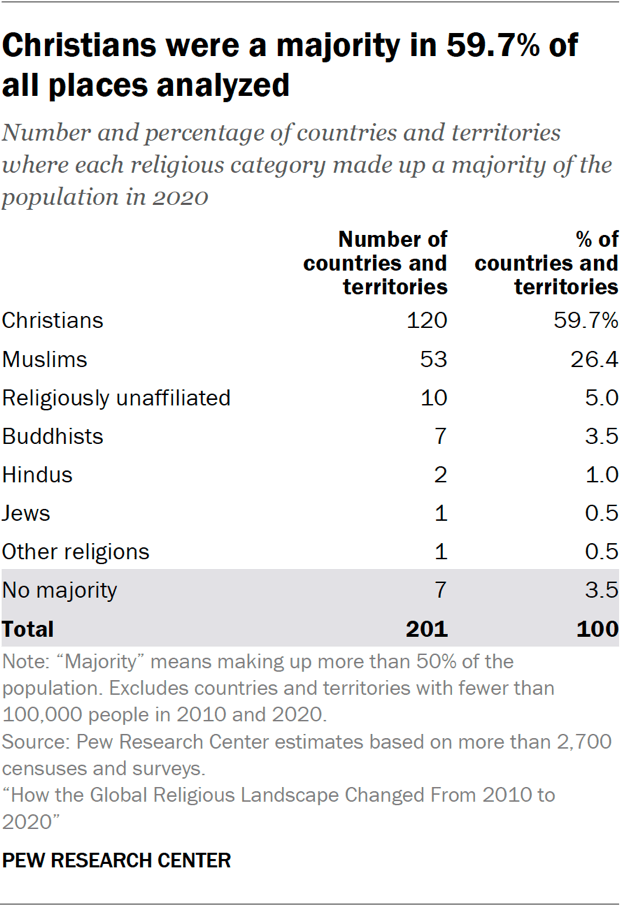
As of 2020, Christians were a majority in 120 countries and territories, down from 124 a decade earlier. Christians dropped below 50% of the population in the United Kingdom (49%), Australia (47%), France (46%) and Uruguay (44%). In each of these places, religiously unaffiliated people now account for 40% or more of the population, and smaller religious groups such as Muslims, Hindus, Buddhists, Jews or adherents of other religions (combined) account for 11% or less.
Over the same period, religiously unaffiliated people became a majority in the Netherlands (54%), Uruguay (52%) and New Zealand (51%), raising the number of places with an unaffiliated majority from seven to 10. (These countries joined China, North Korea, the Czech Republic, Hong Kong, Vietnam, Macao and Japan, which already had religiously unaffiliated majorities in 2010.)

There was no change in the number of places in which the majority of the population are Muslim (53), Buddhist (7), Jewish (1) or followers of other religions (1).7
These are among the key findings of a Pew Research Center of more than 2,700 censuses and surveys, including census data releases that were delayed due to the coronavirus pandemic. The study is part of the Pew-Templeton Global Religious Futures project, which seeks to understand global religious change and its impact on societies.
The rest of this Overview discusses: Why religious change occurred at the global level between 2010 and 2020; the connection between economic development and religious affiliation; religious groups’ geographic distributions and age profiles in 2020; and whether religious groups live as religious majorities or minorities within countries.
It concludes with an explanation of how and why we have revised our 2010 estimates and updated our methods for making demographic estimates.
The chapters in this report cover these topics in more detail:
1. Factors driving religious change, 2010-2020
2. Christian population change
3. Muslim population change
4. Religiously unaffiliated population change
5. Hindu population change
6. Buddhist population change
7. ‘Other religions’ population change
8. Jewish population change
9. Religion in Asia and the Pacific
10. Religion in Europe
11. Religion in Latin America and the Caribbean
12. Religion in the Middle East and North Africa
13. Religion in North America
14. Religion in sub-Saharan Africa
15. Why we revised our estimates for 2010
Why change occurred at the global level
Global change in the size of religious populations is the result of two primary mechanisms: religious “switching” and natural increase (i.e., the difference between births and deaths). The latter is influenced by several demographic factors: age structure, fertility and mortality (or life expectancy).
How much change each mechanism creates varies by religion:
- Religious disaffiliation is the main driver of the decline in the Christian share of the global population.
- Religious disaffiliation – primarily of people leaving Christianity – also is the main driver of the growth of religiously unaffiliated populations.
- Increases in the global Muslim population are largely due to Muslims having a relatively young age structure and high fertility rate, two characteristics that result in natural population growth.
In addition, migration is a source of religious change within some regions and countries. But migration does not affect religious group sizes at the global level (as long as people remain bound to this planet). For more about the regional and country-level impact of migration, read Chapter 1.
Religious ‘switching’
Although most people around the world still identify with the religion in which they were raised, religious switching is pervasive. Overall, there’s been a net movement of people switching into the religiously unaffiliated category.
This Pew Research Center study is the first to report on observed patterns of switching into and out of religious groups at the global level.8 In many countries, this change has followed a generational pattern: Each new generation of young adults has contained a larger share of people who are religiously unaffiliated, either because they were not raised in any religion or because they have switched away from the religion in which they were raised.
Many more people grew up with a religion than grew up with no religion. And most people, as adults, still identify with a religion. But the balance between the groups is changing.

Using surveys from 117 countries and territories, we analyzed data from adult respondents and compared the religion they say they were raised in (as children) with their current religious identity (as adults).9
To capture switching that has occurred in more recent years, we use data from adults ages 18 to 54. Religious switching is more common earlier in life, though it can happen at any age.
We found that for every adult in that age group who says they joined a religion after having been raised without a religion, 3.2 moved in the other direction – they left religion altogether after having been raised in one.
As a result, based on this set of measures, the religiously unaffiliated category has had the largest net gain due to switching.
Christians have experienced the biggest net losses from switching (3.1 have left for every 1.0 who has joined). Most former Christians no longer identify with any religion, but some now identify with a different religion.
Buddhists also have had more people leave than join (1.8 left, 1.0 joined).
Hindus have had more people leave than join, while the reverse is true for Muslims. However, religious switching into or out of these two groups is relatively uncommon, so the modest differences in the ratio of leavers to joiners has a small overall effect on the size of Hindu and Muslim populations.
For more details about religious switching, read Chapter 1.10
Natural increase
Natural population growth – the extent to which births outnumber deaths – is greater for religious groups that have higher fertility rates and lower mortality rates.
In a report published in 2017, we modeled the number of births and deaths that occurred globally between 2010 and 2015. We estimated that Muslims gained the most via natural increase, followed by Christians. By contrast, natural growth among the religiously unaffiliated was modest.
Groups’ varied rates of natural increase are partly the result of geographic distribution. Religions that are concentrated in parts of the globe with relatively high overall population growth (such as the Middle East-North Africa region and sub-Saharan Africa) naturally would expand more quickly than those concentrated in low-growth regions (such as North America, the Asia-Pacific region and Europe).
Muslims and Christians have a large presence in the rapidly growing region of sub-Saharan Africa, but many Christians also live in the slower-growth regions of Europe and the Americas. Religiously unaffiliated people and Buddhists are heavily concentrated in countries that have shrunk as a share of the world’s population, including China and Japan.
Nevertheless, religious differences sometimes appear to play a role in fertility, even after accounting for geography. For example, Nigerian Muslims have a higher average birth rate than Nigerian Christians, and Hindus in India have a higher fertility rate than Buddhists in India. These differences also may be related to other factors, such as education, access to birth control and women’s workforce participation rates.
For more details about natural growth patterns, read Chapter 1.
Economic development and religious affiliation
People in wealthier parts of the world are, on average, less religious than those in societies with less advanced economies. This pattern holds true across many different measures of religion – such as rates of daily prayer and belief in god – and across many indicators of economic development. For example, Pew Research Center in 2018 found that people in countries with higher life expectancy at birth are less likely to attend religious services weekly.11
To get a more general sense of this pattern, it helps to look at country scores on the United Nations’ Human Development Index (HDI), which combines data on life expectancy, education and income.
We find that countries with high HDI scores (i.e., those that are more developed) tend to have lower rates of religious affiliation. In many of these countries, Christianity is the most common religion. In a few Asian countries with high HDI scores and low affiliation rates, Buddhism is the largest religion. In some countries, the religiously unaffiliated category is approaching or already exceeds the largest religious group in size.
Countries with low HDI scores, on the other hand, tend to have high rates of religious affiliation.
Economic development is not perfectly correlated with religion, and there are some countries with high rates of religious affiliation across the range of HDI scores. This includes many Muslim-majority countries, Hindu-majority India and Nepal, and Jewish-majority Israel.

Geographic distribution of religious groups in 2020
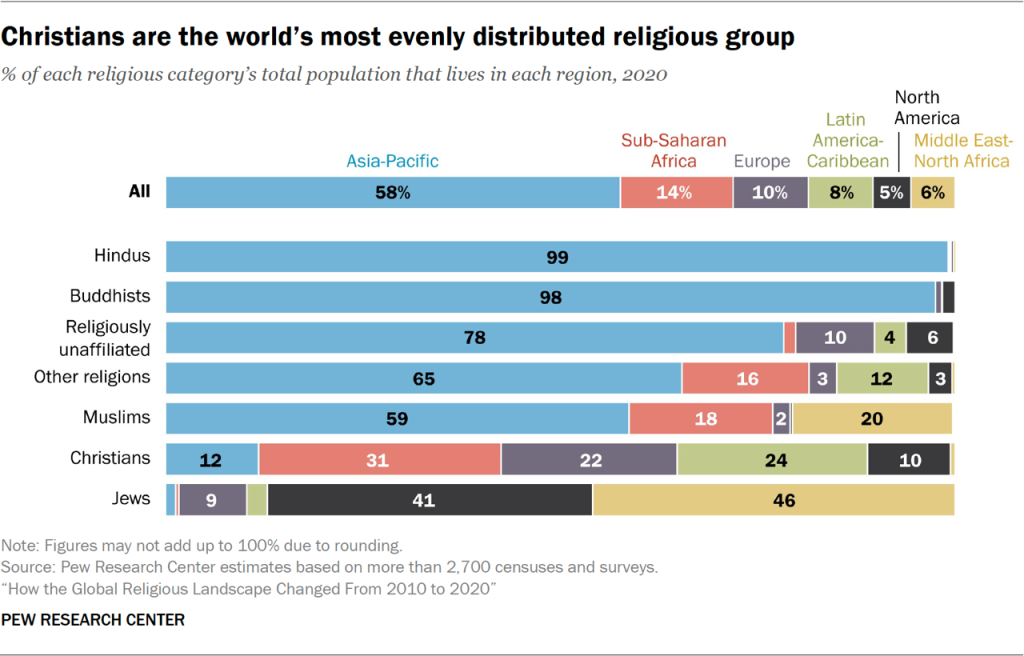
Nearly six-in-ten people worldwide live in the Asia-Pacific region, including most people in five religious categories: 99% of Hindus, 98% of Buddhists, 78% of the religiously unaffiliated, 65% of followers of other religions, and 59% of Muslims.
Christians are the most geographically dispersed group. The largest share of Christians live in sub-Saharan Africa (31%), followed by the Latin America-Caribbean region (24%) and Europe (22%). This is a major geographic change since the early 1900s, when Christians in sub-Saharan Africa made up 1% of the global Christian population and two-thirds of Christians lived in Europe.
Most Jews live either in the Middle East-North Africa region or in North America.
Age profile of religious groups in 2020
As of 2020, Muslims have the highest proportion of children in their population (33% of all Muslims worldwide are under 15). Jews and Buddhists have the highest proportion of older adults; 36% in each group are ages 50 and older.
Much of the variation in the age structure of religious groups is driven by their geographic concentration. For example, about half of the world’s Jews live in North America and Europe, regions that have relatively old populations.
The youthfulness of Muslims is tied to the fact that nearly four-in-ten of the world’s Muslims live in sub-Saharan Africa and the Middle East-North Africa region – places with relatively young populations.

Christians have a large presence in many regions, from the most youthful (sub-Saharan Africa) to the least (Europe). Among religious groups, Christians have the median age (30.8 years) closest to the world’s overall median age (30.6).
If religious groups are heavily clustered in just one country, their global age structure reflects that country’s characteristics. For instance, the global age distribution of Hindus mirrors the age distribution of India, which is home to 95% of the world’s Hindus. Similarly, the age profile of religiously unaffiliated people resembles that of China, which is home to 67% of all unaffiliated people.

Do people mostly live as religious majorities or minorities?
Around the world, 80% of all people live in a place in which most other people share their religious identity. People living as a religious minority in their country make up 20% of the world’s population.
This analysis does not divide the seven major religious categories into subgroups, so Protestants living in Catholic-majority countries or Shiite Muslims living in Sunni-majority countries, for example, are considered to be living in a place where their broader faith is in the majority.

Hindus are most likely to live as a religious majority, with 97% living in the world’s two Hindu-majority countries, India and Nepal. About eight-in-ten Muslims are part of a religious majority, as are similar shares of Christians and religiously unaffiliated people. Slightly fewer than half of all Buddhists and Jews live as a majority.
The world’s seven Buddhist-majority countries (Cambodia; Thailand; Myanmar, also known as Burma; Bhutan; Sri Lanka; Laos; and Mongolia) are home to 47% of all Buddhists. Israel, the sole Jewish-majority country, is home to 46% of all Jews. Taiwan is the only place where members of other religions are in the majority, and 7% of all people in the “other religion” category, worldwide, live in Taiwan. (Many Taiwanese people practice Daoism and traditional folk religions. Read more about Taiwan’s religious beliefs and practices in our report “Religion and Spirituality in East Asian Societies.”)
Revising previous estimates
The 2010 estimates in this report differ from what we have published in the past. We adjusted our data sources and methods to make our estimates for 2010 and 2020 as reliable and comparable as possible.
Most consequentially, we changed how we measure China’s religious composition. In the past, we used custom estimates for China to adjust for the fact that surveys in China often do not fully capture people’s religious identity. This report relies on measures of zongjiao religious identity, as these are the most comparable with what we use in every other country, as well as the most readily comparable over time in China. (The measure of formal zongjiao religious identity commonly used in Chinese surveys excludes people who engage in religious or spiritual beliefs and practices but do not consider themselves affiliated with any religion.)
According to our new approach, 10% of China’s population identified with a religion in 2020, the lowest share of any country in the study. Since China has such a large population, this new approach has increased our estimate of the religiously unaffiliated share of the world’s population.
Read more about the challenges of measuring religion in China in our 2023 report. More information about improvements in our methodology is available in Chapter 15 and in the Methodology.


