On a global level, religious groups expand and shrink due to a mix of factors.
Demographic factors, such as age structure, fertility and mortality (or life expectancy), tell us whether people in various religious categories are generally young and bearing many children, or whether they are older and likely past their prime childbearing years. Younger groups with relatively high fertility and longer life expectancies have a demographic advantage because of their greater potential for “natural increase.”
Another factor that causes groups to change in size is religious “switching” – people moving into and out of religious groups, including people who choose to switch out of religion altogether.12
The changes in religious composition that happened between 2010 and 2020 resulted from a combination of these factors. The importance of each factor varies by religion:
- Christians are shrinking as a share of the global population due to widespread switching out of religion. This “religious disaffiliation” among Christians overrides their demographic advantage (high fertility).
- Conversely, the growth of the religiously unaffiliated is the result of large numbers of people – mostly Christians – switching into the ranks of the unaffiliated (overcoming that population’s demographic disadvantages of an older age structure and relatively low fertility).
- Muslim population growth is largely driven by Muslims’ relatively young age structure and high fertility rate.
- Hindus remain a stable share of the world’s population because their fertility resembles the global average, and surveys indicate that Hindus rarely switch out of their religion.
- Buddhists are declining not only due to their demographic disadvantages (such as older age structure and low fertility), but also because many people who were raised Buddhist are switching out of the group.
- Jews lag behind global population growth – despite having fertility rates on par with the global average – due to their older age structure.
In addition to the demographic dynamics that affect religious change globally, migration is a large source of religious change within a few regions and countries. (Migration does not affect the size of religious groups at the global level.)
Age structure and fertility
All else being equal, a younger population has a demographic “advantage” for growth. That’s because a young population has a relatively large percentage of women who are in – or soon will enter – their childbearing years, and a relatively small percentage of older adults nearing the end of their lives.
The effect of a group’s age structure may be amplified or muted by its fertility rate. To understand religious change since 2010, it helps to look at where each of these indicators stood at the start of the decade.
Age structure
In 2010, Muslims had a relatively advantageous age structure, while Jews, Buddhists and the religiously unaffiliated were at a demographic disadvantage. (Hindus are relatively young, but they are concentrated in countries with relatively low life expectancy.)
- Muslims had the highest proportion of children in 2010 (35% of the world’s Muslims were under the age of 15), followed by Hindus (31%).
- Jews had the highest proportion of older adults (33% of the world’s Jews were 50 or older in 2010), followed by Buddhists (30%).
- The religiously unaffiliated had the smallest share of people under 15 (19%) while Muslims had the smallest share of adults ages 50 and older (13%).

In most religious groups, about half of all women are in the broad reproductive age range of 15 to 49. But there is substantial variation in the share of women in the younger reproductive age range of 15 to 29.13

In 2010, Muslims had a relatively large share of women in these younger reproductive years, followed by Hindus. On the other hand, Buddhists and Jews had smaller shares of women between the ages of 15 and 29.
Fertility
When religion is transmitted from mother to child, and child mortality rates are low, groups with higher fertility rates will generally grow faster. (In this report, we focus on the total fertility rate, i.e., the average number of children a woman is expected to have in her lifetime.)14
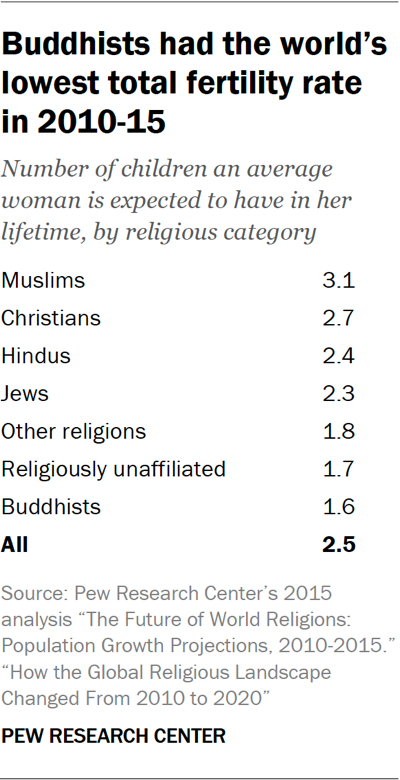
Muslims were estimated to have the highest total fertility rate, with an average of 3.1 children per woman in the 2010-15 period, according to a previous Pew Research Center study. Christians followed with 2.7 children.
Buddhists (1.6 children per woman), religiously unaffiliated people (1.7) and members of other religions (1.8) had the lowest fertility rates.
In the absence of change from migration, a group typically must have a total fertility rate of at least 2.1 (“replacement level”) to maintain its size. However, it can take considerable time for below-replacement-level fertility rates to lead to population decline. For example, fertility rates in China dropped below the replacement level in the early 1990s, but China’s population did not begin to shrink until three decades later.
Religious ‘switching’
If demographic factors were the only drivers of change, young groups with high fertility would usually grow more quickly than groups that are older and have fewer children. As of 2010, Christians around the world were younger and had more children, on average, than religiously unaffiliated people.
But demographic factors can be amplified or offset by another mechanism: religious “switching” (i.e., people leaving one religion and joining another, or leaving religion altogether). Religious switching explains why Christian populations shrank between 2010 and 2020, while religiously unaffiliated populations grew. Christians have a high fertility rate, but they have been losing adherents as people switch out of Christianity to become religiously unaffiliated.
Pew Research Center previously has analyzed religious switching rates at the country level, within 102 countries and territories. In the current report, we conducted a new analysis to understand how switching within countries impacted the size of religious groups on a global level.15
For this analysis, we aggregated rates of religious switching from 117 countries and territories that cover 92% of the 2010 global population.16 For the remaining 8%, or 84 countries and territories (with population sizes above 100,000 in either 2010 or 2020), we assume that no switching took place because we have no data measuring religious switching in this slice of the world.
Research on religious switching generally finds that if people move away from their childhood religion, they tend to do so by the end of their young adult years. For example, in the American Enterprise Institute’s American National Family Life Survey, 75% of respondents ages 65 and older who had left their childhood religion reported that they had done so by the time they were 30.
To capture recent religious switching and exclude more of the switching that happened during the last century, this analysis focuses on the experiences of survey respondents ages 18 to 54.
The surveys we analyze do not allow us to isolate the religious switching that took place exclusively between 2010 and 2020. Rather, they provide an overview of switching patterns that have shifted religious landscapes in recent decades.
(Read the Methodology for more on our data and methods used to compute rates of religious switching.)17
This analysis focuses on quantifying how common switching in and out is for each religious category. We find that, globally:
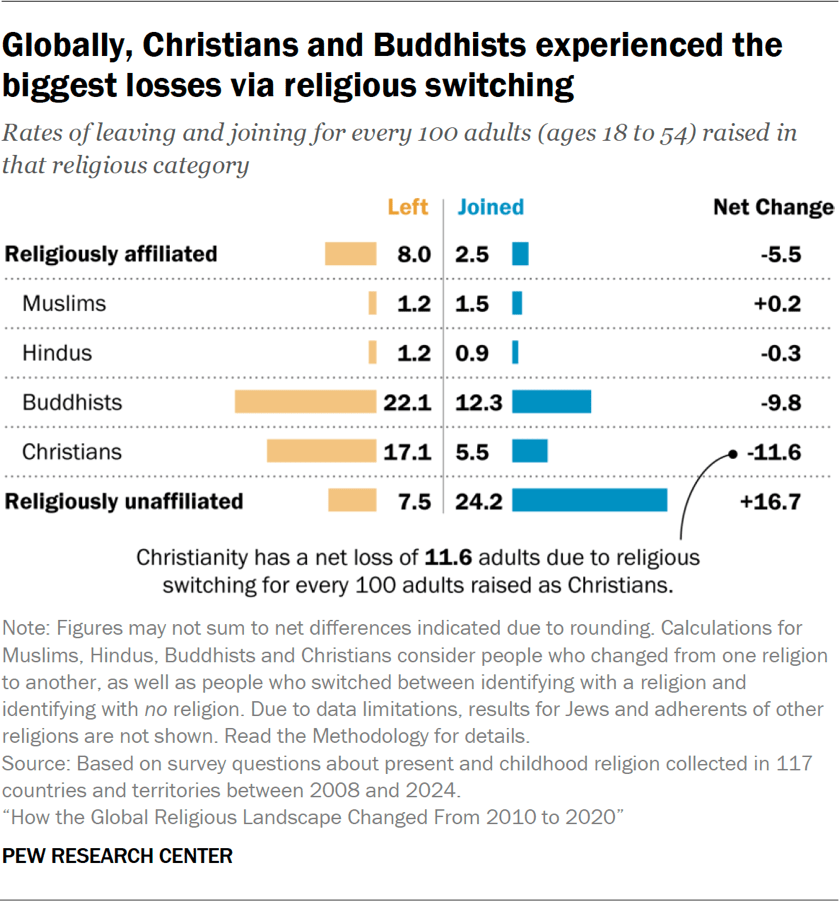
The religiously unaffiliated population has experienced the most growth from religious switching. On average, for every 100 people ages 18 to 54 who were raised with no religion, 7.5 people have left and 24.2 have joined the ranks of the unaffiliated, resulting in a net gain of 16.7 people.
Christians and Buddhists have experienced the greatest overall losses due to religious switching. For every 100 adults in the 18- to 54-year-old age range who were raised Christian, there was a net loss of 11.6 people (17.1 left and 5.5 joined). Buddhists have lost 9.8 people for every 100 raised Buddhist (22.1 left and 12.3 joined).
Muslims and Hindus have been the least likely to gain or lose adherents from religious switching. About one in every 100 adults raised Muslim (or Hindu) has left their childhood religion, and a similar number from a different religious category have switched into Islam (or Hinduism).18
Since Jewish populations are relatively small in most countries, survey data measuring Jewish switching patterns typically comes from a small number of respondents. However, we do have sufficient data to measure movement into and out of Judaism in Israel and the U.S. In our 2024 Israel survey, rates both of entering and of leaving Judaism were very low. In the U.S. Religious Landscape Studies we conducted in 2014 and in 2023-24, leaving Judaism was slightly more common than joining the religion, though the difference was within the margins of error.
An additional complication is that many people who cease to identify religiously as Jewish may continue to identify as Jewish in some other way, such as culturally, ethnically, or by family background. In our analyses of religious switching, we use the term “Jewish” to refer only to religious identity, because the survey questions ask about a person’s current religion and what religious group they were raised in (their childhood religion).
The “other religions” category also makes up a small share of respondents in most countries. Due to concerns about the small sample sizes for Jews and members of other religions in many surveys, global rates of switching for these groups are not shown in this report. For more details, read the Methodology.
Mortality (life expectancy)
There can be more growth in a population if death rates decline and people gradually live longer lives. We can describe mortality patterns with statistics about the number of deaths experienced for every 1,000 people in various age groups over a given period. However, it is often simpler to consider what these death rates suggest about the expected longevity of human life.
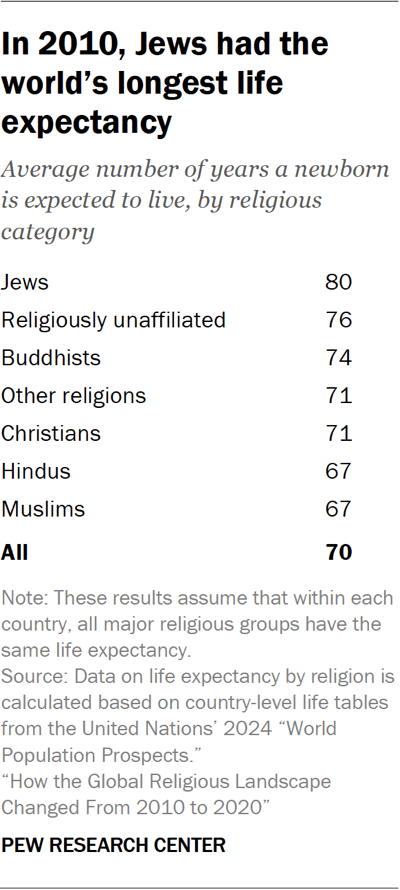
Life expectancy at birth – an approximate estimate of the expected lifespan of an average newborn child – is a convenient snapshot of the mortality rates at a moment in time.19 If all other factors were equal, groups with higher life expectancies in 2010 would live longer and have larger populations by 2020.
Among all religious groups, Jews were concentrated in countries with the highest life expectancy at birth in 2010, with an estimated global average of 80 years, followed by the religiously unaffiliated (76) and Buddhists (74). Hindus and Muslims were concentrated in countries with the lowest life expectancy, 67 years for each, well below the global average of 70 years.
Migration
Migration cannot change the size of global religious populations, but it is a primary driver of change in the size of some religious groups in certain parts of the world. Migration contributes especially to the growth of non-Muslims in the Gulf Cooperation Council (GCC) countries and the growth of Muslims in North America and Europe.
Between 2010 and 2020, the number of people living outside their country of birth rose by more than 50 million (about the size of Italy’s total population), according to the United Nations’ migrant stock estimates. In addition to the ongoing movement of people to wealthy nations in search of economic opportunities, much of the surge in migrants during this period can be attributed to Syrians fleeing civil war (about 7.5 million) and Venezuelans fleeing economic and political instability (roughly 5 million).
Generally, migration has a limited impact on a country’s religious makeup because migrants often constitute a small fraction of a society’s total population, and migrants often move to countries where their religious identity is already prevalent. For instance, the vast majority of Syrian refugees arriving in Turkey over the past decade are Muslims, and Venezuelans moving to the nearby countries of Colombia, Peru and Ecuador are predominantly Christians. In these places, the surge of migrants itself was not the cause of much religious change between 2010 and 2020.
Still, migration did affect the religious mix in some places between 2010 and 2020. For example, in Lebanon, which was 62% Muslim in 2010, the large influx of Syrian refugees contributed to a 5 percentage point increase in the share of Lebanon’s population that was Muslim in 2020.
Among the GCC countries, Oman experienced a large increase in the share of its population that is not Muslim. Non-Muslims – mostly Christians and Hindus – now comprise 19% of Oman’s population (up 8 points), as of 2020. In Kuwait, the United Arab Emirates and Saudi Arabia, the share of non-Muslims rose by 2 points each.
The six GCC countries (Bahrain, Kuwait, Oman, Qatar, Saudi Arabia and the United Arab Emirates) have some of the world’s largest shares of foreign-born residents. And unlike native-born GCC residents (who almost always identify as Muslim), about a quarter of migrants living in GCC countries (who mostly originate from South Asia) are estimated to be Christians and Hindus, according to Pew Research Center’s 2024 study of the religious composition of the world’s migrants.
Europe’s Muslim population growth since 2010 also has been driven largely by migration. In 2020, Muslims made up 6% of Europe’s population, up about 1 point from 2010. Growth was concentrated in Sweden, Austria and Germany, which took in large numbers of Syrian war refugees. The region’s total Muslim count increased by 6.2 million during the decade, including an estimated 3.5 million Muslims who were born outside Europe. Nearly 1 million came from Syria.
Migration accounted for a large portion of the increase in North America’s Muslim population, which grew to make up 1.6% of the region’s residents in 2020 (up 0.4 points). Muslim migrants to North America came primarily from South Asia and the Middle East-North Africa region. Migration also fueled the growth of Hindus in North America, whose share increased to 1.0% (up 0.3 points).
(For more estimates by religion and geographic region, refer to “Religious composition of the world’s migrants, 1990-2020.”)


