The American Trends Panel survey methodology
Overview
The American Trends Panel (ATP), created by Pew Research Center, is a nationally representative panel of randomly selected U.S. adults. Panelists participate via self-administered web surveys. Panelists who do not have internet access at home are provided with a tablet and wireless internet connection. Interviews are conducted in both English and Spanish. The panel is being managed by Ipsos.
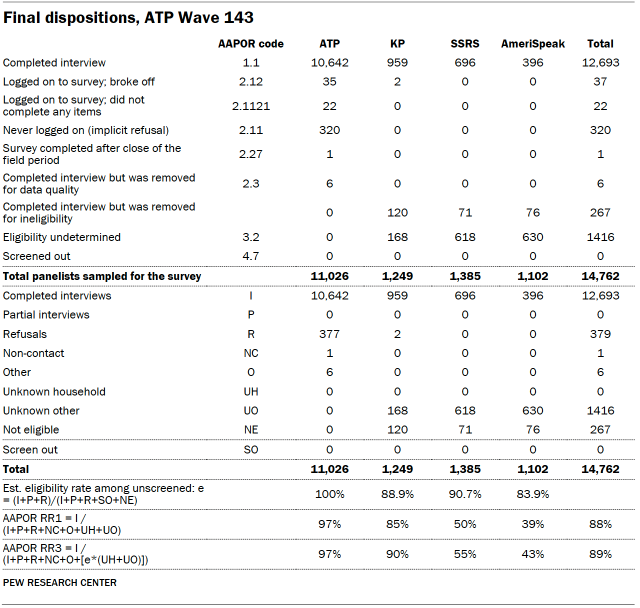
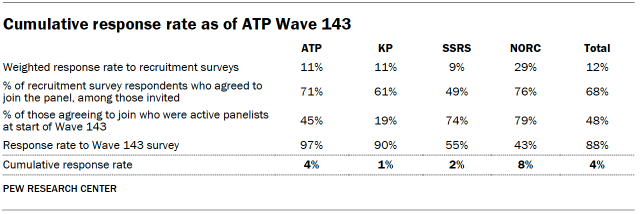
Data in this report is drawn from ATP Wave 143, conducted from Feb. 13 to 25, 2024. A total of 12,693 panelists responded out of 14,762 who were sampled, for a response rate of 89% (AAPOR RR3). The survey includes an oversample of 2,051 Jewish and Muslim Americans from Ipsos’ KnowledgePanel, SSRS’s Opinion Panel, and NORC at the University of Chicago’s AmeriSpeak Panel. These oversampled groups are weighted to reflect their correct proportions in the population. The cumulative response rate accounting for nonresponse to the recruitment surveys and attrition is 4%. The break-off rate among panelists who logged on to the survey and completed at least one item is less than 1%. The margin of sampling error for the full sample of 12,693 respondents is plus or minus 1.5 percentage points.
ATP Panel recruitment
The ATP was created in 2014, with the first cohort of panelists invited to join the panel at the end of a large, national, landline and cellphone random-digit-dial survey that was conducted in both English and Spanish. Two additional recruitments were conducted using the same method in 2015 and 2017, respectively. Across these three surveys, a total of 19,718 adults were invited to join the ATP, of whom 9,942 (50%) agreed to participate.
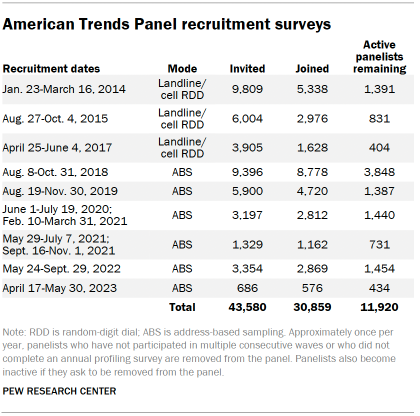
In August 2018, the ATP switched from telephone to address-based sampling (ABS) recruitment. A study cover letter and a pre-incentive are mailed to a stratified, random sample of households selected from the U.S. Postal Service’s Delivery Sequence File. This Postal Service file has been estimated to cover as much as 98% of the population, although some studies suggest that the coverage could be in the low 90% range.3 Within each sampled household, the adult with the next birthday is asked to participate. Other details of the ABS recruitment protocol have changed over time but are available upon request.4
We have recruited a national sample of U.S. adults to the ATP approximately once per year since 2014. In some years, the recruitment has included additional efforts (known as an “oversample”) to boost sample size with underrepresented groups. For example, Hispanic, Black and Asian adults were oversampled in 2019, 2022 and 2023, respectively.
Across the six address-based recruitments, a total of 23,862 adults were invited to join the ATP, of whom 20,917 agreed to join the panel and completed an initial profile survey. Of the 30,859 individuals who have ever joined the ATP, 11,920 remained active panelists and continued to receive survey invitations at the time this survey was conducted.
The American Trends Panel never uses breakout routers or chains that direct respondents to additional surveys.
Sample design
The overall target population for this survey was noninstitutionalized persons ages 18 and older living in the U.S., including Alaska and Hawaii. All active panel members who completed the ATP wave which fielded from July 31 to Aug. 6, 2023 (ATP W132), or panelists who previously identified as Jewish or Muslim, were invited to participate in this wave.
The ATP was supplemented with an oversample of self-identified Jewish and Muslim American panelists from three other probability panels: Ipsos’ KnowledgePanel, SSRS’s Opinion Panel, and NORC at the University of Chicago’s AmeriSpeak Panel. All panelists who met the selection criteria were selected with certainty.
Questionnaire development and testing
The questionnaire was developed by Pew Research Center in consultation with Ipsos, SSRS and NORC. The survey for ATP and KP panelists was programmed by Ipsos, while the survey for SSRS and NORC panelists was programmed by SSRS. A small number of SSRS panelists took their survey over the phone with an interviewer. Both web programs were rigorously tested on both PC and mobile devices by the Ipsos, SSRS and NORC project management teams and Pew Research Center researchers. The Ipsos project management team also populated test data that was analyzed in SPSS to ensure the logic and randomizations were working as intended before launching the survey.
Incentives
All ATP respondents were offered a post-paid incentive for their participation. Respondents could choose to receive the post-paid incentive in the form of a check or a gift code to Amazon.com or could choose to decline the incentive. Incentive amounts ranged from $5 to $20 depending on whether the respondent belongs to a part of the population that is harder or easier to reach. Differential incentive amounts were designed to increase panel survey participation among groups that traditionally have low survey response propensities.
Respondents from the Ipsos KnowledgePanel, SSRS Opinion Panel and AmeriSpeak were offered the cash equivalent of $10 for completing this survey.
Data collection protocol
The data collection field period for this survey was Feb. 13 to 25, 2024. Postcard notifications were mailed to a subset of ATP panelists with a known residential address on Feb. 12.5
Invitations were sent out in separate launches. Sixty ATP panelists and 300 KP panelists were included in the soft launch, which began with an initial invitation sent on Feb. 13. The ATP and KP panelists chosen for the soft launch were known responders who had completed previous surveys within one day of receiving their invitation. All remaining ATP and KP sampled panelists were included in the full launch and were sent an invitation on Feb. 14.
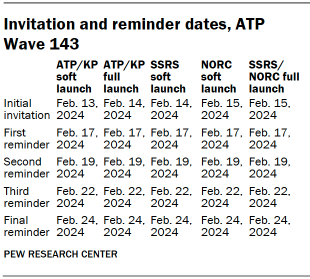
Overall, 129 SSRS panelists were included in the SSRS soft launch, which began with an initial invitation on Feb. 14. And 110 NORC panelists were included in the NORC soft launch, which began with an initial invitation on Feb. 15. All remaining SSRS and NORC sampled panelists were included together in the full launch and were sent an invitation on Feb. 15.
All panelists with an email address received an email invitation and up to four email reminders if they did not respond to the survey. All ATP panelists who consented to SMS messages received an SMS invitation and up to four SMS reminders.
Data quality checks
To ensure high-quality data, the Center’s researchers performed data quality checks to identify any respondents showing clear patterns of satisficing. This includes checking for whether respondents left questions blank at very high rates or always selected the first or last answer presented. As a result of this checking, six ATP respondents were removed from the survey dataset prior to weighting and analysis.
Weighting
The data was weighted in a multistep process that accounts for multiple stages of sampling and nonresponse that occur at different points in the survey process. First, each panelist begins with a base weight that reflects their probability of inclusion in the panel to which they belong. Separately for each of the four panels (ATP, KP, SSRS, NORC), the base weights for Muslim and Jewish respondents were scaled to be proportional to the group’s effective sample size. These weights were then combined and calibrated so that the overall proportions of Jewish and Muslim respondents respectively match the National Public Opinion Reference Survey (NPORS) benchmark.
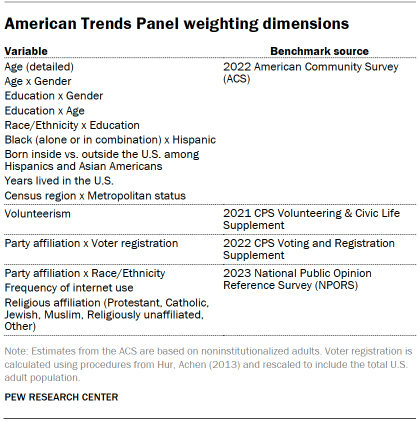
This weight is then calibrated again to align with the full set of population benchmarks identified in the accompanying table (which also includes the NPORS benchmarks for the shares of Jewish and Muslim adults). In order to reduce the loss in precision stemming from variance in the weights, the weights were trimmed separately among Jewish, Muslim, Hispanic, non-Hispanic Black, and non-Hispanic Asian respondents at the 98th percentile, and among all other respondents at the 99.5th percentile. Sampling errors and tests of statistical significance take into account the effect of weighting.
The following table shows the unweighted sample sizes and the error attributable to sampling that would be expected at the 95% level of confidence for different groups in the survey.
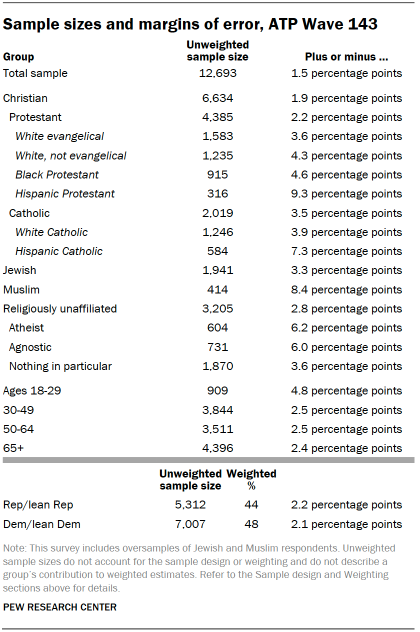
Sample sizes and sampling errors for other subgroups are available upon request. In addition to sampling error, one should bear in mind that question wording and practical difficulties in conducting surveys can introduce error or bias into the findings of opinion polls.
Dispositions and response rates
© Pew Research Center, 2024