Most Jewish adults report that they are satisfied with multiple aspects of their lives, including at least eight-in-ten who describe their family life, physical health and community as “good” or “excellent.”
As a whole, U.S. Jews are a relatively high-income group, with roughly half saying their annual household income is at least $100,000 – much higher than the percentage of all U.S. households at that level. In addition, about half of the Jewish adults surveyed describe themselves as living “comfortably,” while three-in-ten say they are able to meet basic expenses with a little money left over; another 15% say they just meet basic expenses.
However, some Jews, particularly those with lower household incomes, report that they have difficulty paying for necessities. For example, 26% of all U.S. Jews – including 55% of those who earn less than $50,000 per year – say that, in the year prior to taking the survey, they had difficulty paying for medical care, their rent or mortgage, food, or other bills or debts.
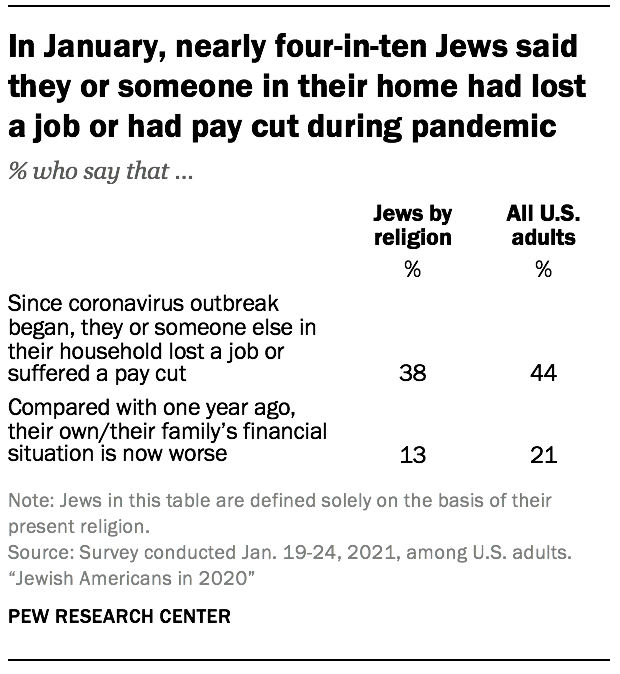
These results largely reflect the economic circumstances of American Jews before the start of the coronavirus pandemic, since the large majority of responses were recorded before the U.S. outbreak escalated in mid-March 2020. A more recent survey of the overall public, conducted in January 2021, found that 38% of Jews by religion said they or someone else in their household had lost a job or suffered a pay cut since the pandemic began.44 This is on par with the share of all U.S. adults who said the same (44%). The January survey also found that Jews by religion were slightly less likely than U.S. adults as a whole to say their household financial situation had worsened over the course of the previous year (13% vs. 21%).
The remainder of this chapter describes Jewish Americans’ economic situation based on the main survey, conducted from November 2019 through June 2020.
U.S. Jews generally satisfied with their lives and communities
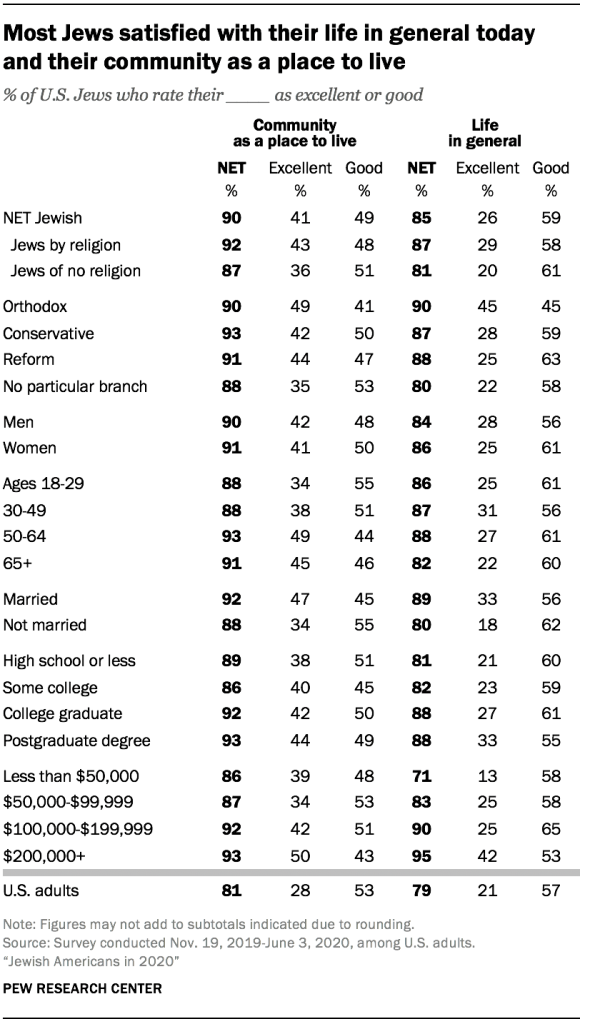
The main survey of U.S. Jews, conducted mostly prior to the coronavirus pandemic, finds that nine-in-ten U.S. Jews say their community is an excellent (41%) or good (49%) place to live, while just one-in-ten rate the community where they reside as only fair or poor. Most U.S. Jews also answer a question about “the way things are going in your life today” with ratings of either excellent (26%) or good (59%).
Substantial majorities of U.S. Jews give these largely positive assessments regardless of gender, age, marital status, education or income, although there are differences across some subgroups. For instance, Jews who report a household income of at least $200,000 are more likely than those who make less than $50,000 per year to describe their lives in positive terms (95% vs. 71%) and to rate their communities as good or excellent places to live (93% vs. 86%). And Jews who are married are more likely to express the highest level of satisfaction with their lives and communities.
Compared with U.S. adults overall, Jewish adults are somewhat more satisfied with their communities (90% vs. 81%) and the way things are going in their lives (85% vs. 79%).
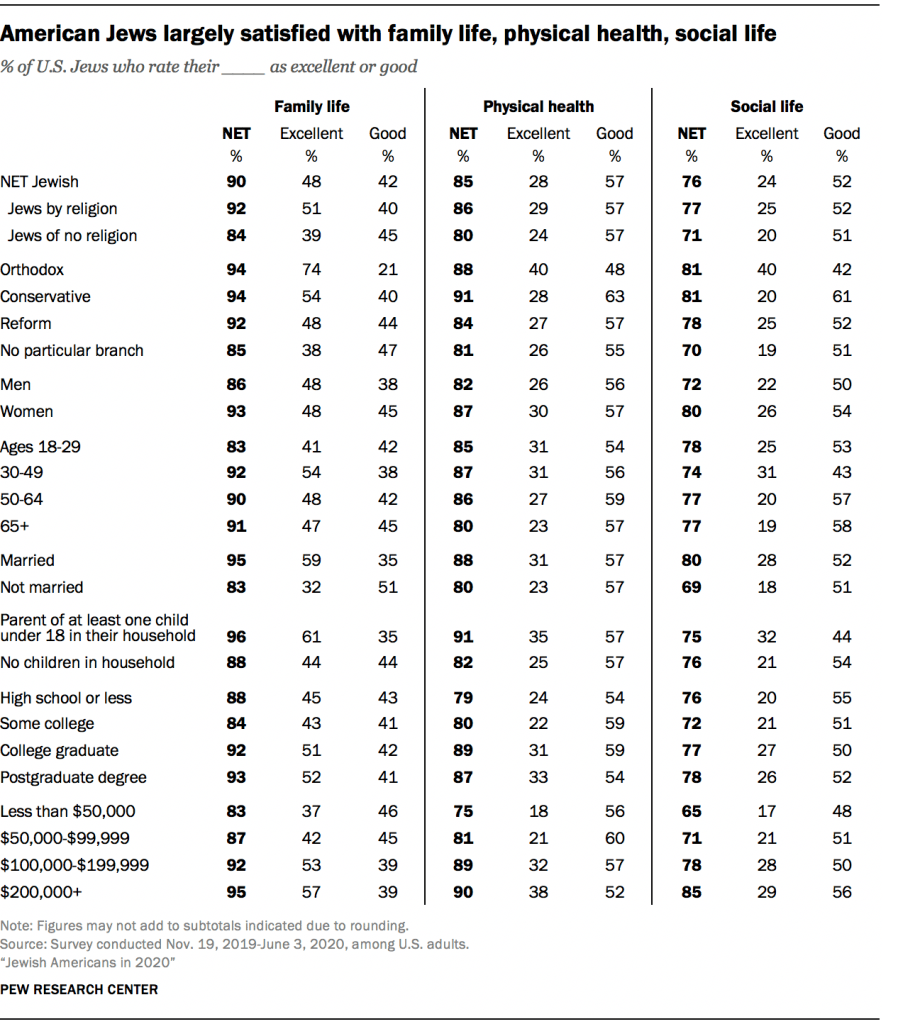
Upwards of eight-in-ten Jewish adults also say their family life (90%) and physical health (85%) are at least good, if not excellent. And three-quarters say the same about their social life.
While most Jewish Americans report a high level of satisfaction with these aspects of their lives, household income is linked with some differences. For example, among Jews who live in a household with an income of $200,000 or more, 95% describe their family life in positive terms, compared with 83% of those with incomes less than $50,000. Those in the highest income bracket also are more likely to be satisfied with their social life and physical health than are respondents with the lowest incomes.
Being a parent is tied to life satisfaction in some ways. Fully 96% of U.S. Jews who are parents of minor children living in their household say they are satisfied with their family life, compared with 88% of all other Jewish adults. Likewise, Jewish parents are more satisfied with their physical health (91%) than are Jews who are not parents (82%). However, this pattern does not extend to social life. Jews who are parents and those who are not express similar levels of satisfaction with their social life.
On average, Jews report higher household incomes than other Americans
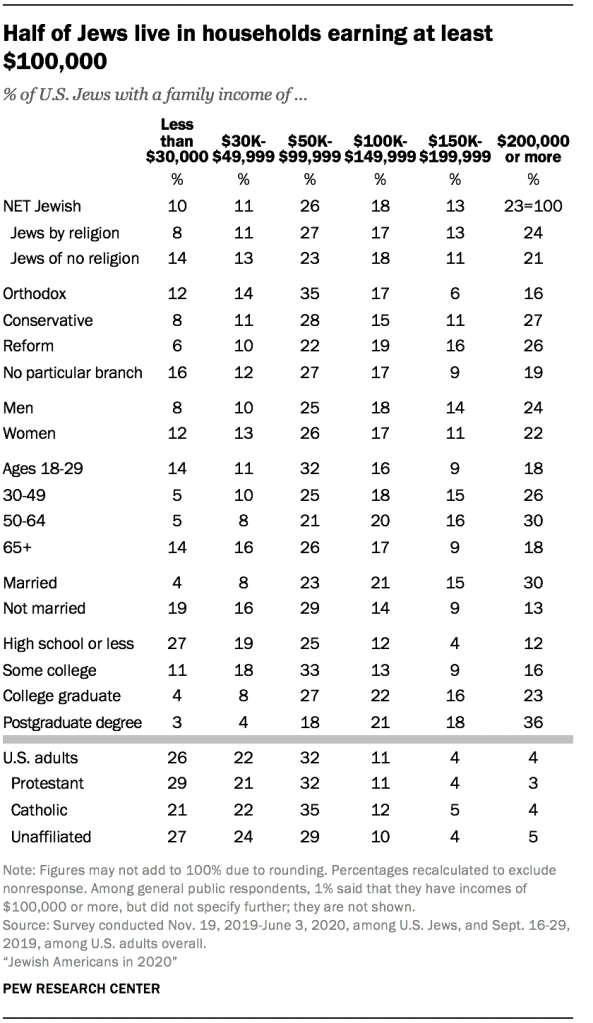
As a whole, Jews are a relatively high-income group. About one-in-four Jews (23%) say they have family incomes of $200,000 or more. By comparison, just 4% of U.S. adults report that level of household income.45
At the other end of the spectrum, one-in-ten U.S. Jews report annual household incomes of less than $30,000, far fewer than the 26% of all U.S. adults who are below that threshold.
Conservative and Reform Jews are substantially more likely than those who are Orthodox to have higher incomes ($100,000 and above).
Jewish adults younger than 30 or older than 64 are more likely than those in between to say they have family incomes less than $30,000. Jews without a college education also are more likely to have low household incomes. About one-quarter of Jews with a high school education or less (27%) say they have household incomes below $30,000, while just 4% of college graduates say the same.
Results on this question are not directly comparable to the 2013 Jewish study. An experiment conducted in conjunction with the 2020 survey indicates that more respondents answer this question about their household income (i.e., fewer people declined to provide financial information) when answering online or by mail (as in 2020) than when speaking to a live interviewer by telephone (as in 2013). More respondents also say they have household incomes over $75,000 when answering by web or mail. See Appendix B for more information.
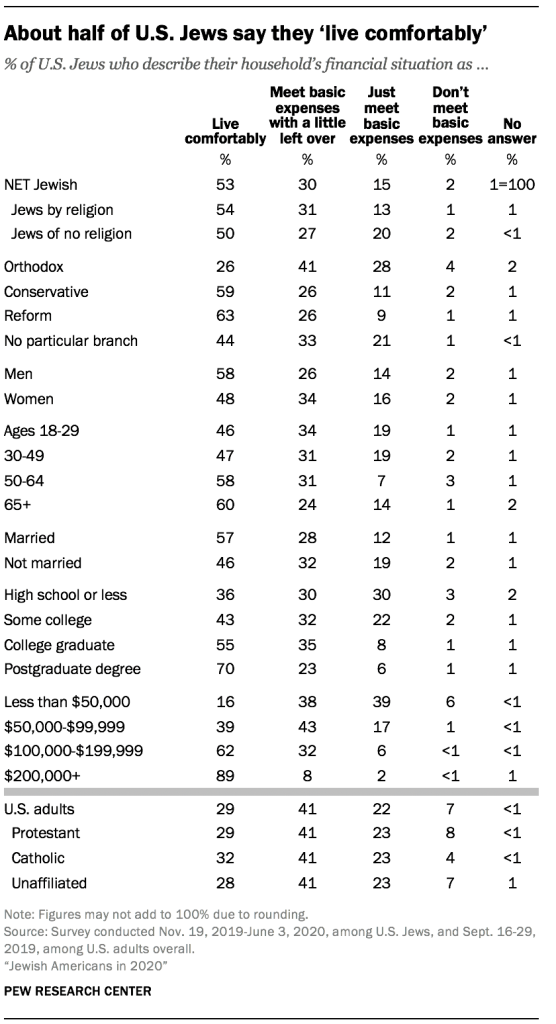
When asked to describe their household’s financial situation (largely before the pandemic began), roughly half of U.S. Jews say they live comfortably (53%). By comparison, 29% of U.S. adults overall say they live comfortably.
Three-in-ten Jews say they meet basic expenses with a little left over (30%), and 15% say their household just meets basic expenses. Relatively few (2%) say they don’t have enough money to meet basic expenses. Jews are less likely than Americans overall to fall into each of these three categories.
Among Jews with household incomes of at least $200,000, about nine-in-ten (89%) say they live comfortably, much higher than in other income categories. Meanwhile, about four-in-ten U.S. Jews with an income of less than $50,000 (39%) say their household just meets basic expenses, and 6% in this group say they cannot meet basic expenses.
Economic well-being is often linked with education, and that is the case here as well. Compared with more highly educated Jews, those without any college education are the least likely to say they live comfortably (36%) and the most likely to say their household is able just to meet basic expenses (30%).
There also are differences across Jewish branches on this question, with Orthodox Jews (26%) much less likely than Conservative (59%) or Reform (63%) Jews to say they live comfortably.
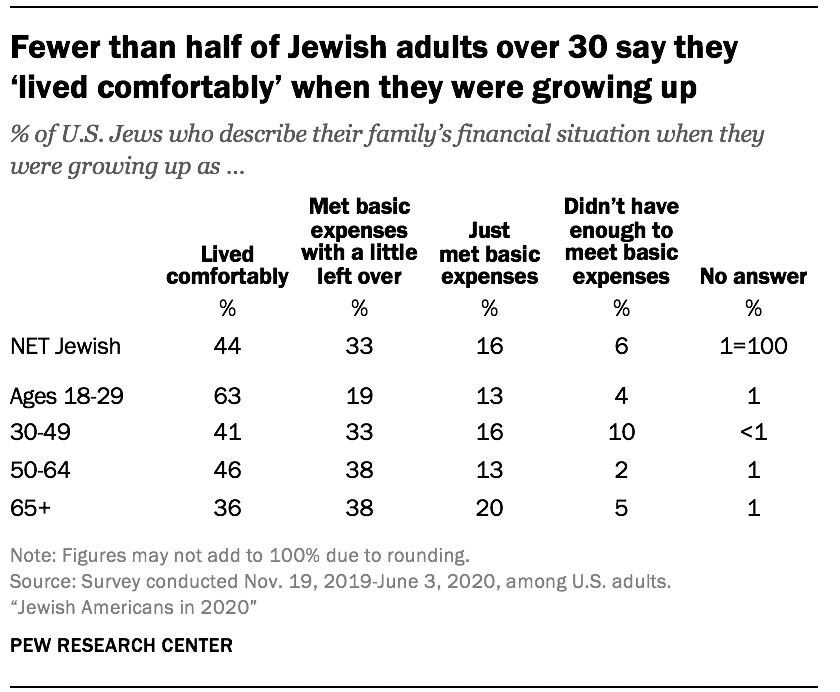
The survey also asked Jewish Americans about the financial status of their family when they were growing up. Jewish adults under 30 are much more likely than their elders to say their family lived comfortably during their childhood, which suggests there has been a rise in the U.S. Jews’ standard of living across recent generations.
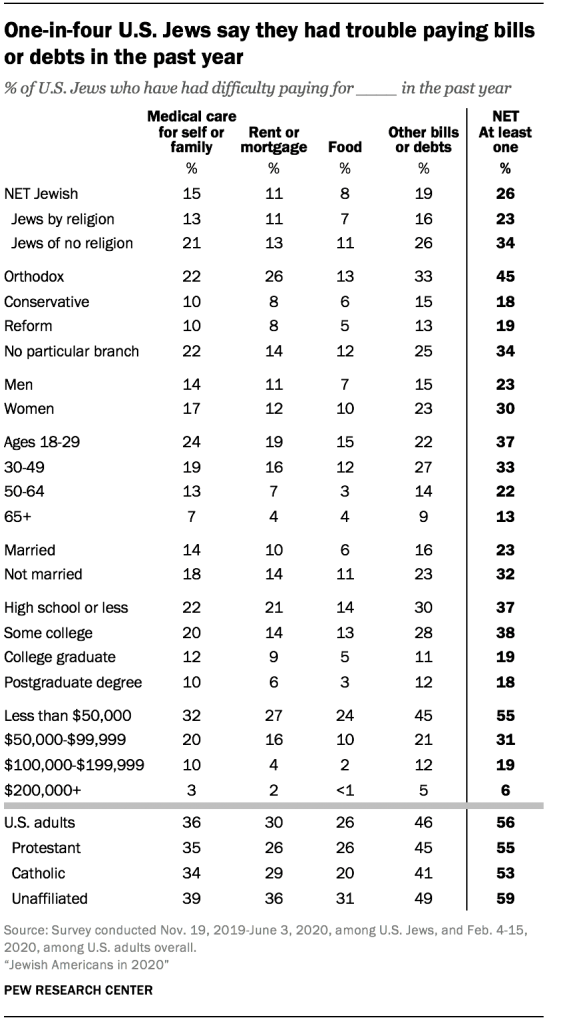
Among U.S. Jews, 15% say they had difficulty paying for medical care for themselves or their family in the year prior to taking the survey, and 11% say they had difficulty paying their rent or mortgage. Somewhat fewer (8%) say they had a difficult time paying for food, but about one-in-five (19%) had trouble paying other types of bills or debts.
By comparison, among U.S. adults overall, one-quarter or more report having had difficulty paying for medical care, housing or food, and nearly half (46%) say they had difficulty paying other bills or debts in the year prior to taking the survey, which preceded the coronavirus outbreak in the United States.
In total, 26% of U.S. Jews say they had difficulty paying for at least one of the four types of necessities mentioned in the survey, about half the percentage of U.S. adults overall who say the same (56%). Jews of no religion are more likely than Jews by religion to report this kind of financial stress (34% vs. 23%).
For Jews, difficulty paying for some necessities is concentrated among those with lower household incomes, the Orthodox, Jewish adults under 50, those who are not married and those without a college degree. For example, 55% of Jews with household incomes of less than $50,000 say they had difficulty covering their living expenses in the past year. And roughly one-third of Jewish adults under the age of 50 (34%) say they had difficulty paying for medical care, housing, food or other expenses in the past year.
Most U.S. Jews are employed at least part time
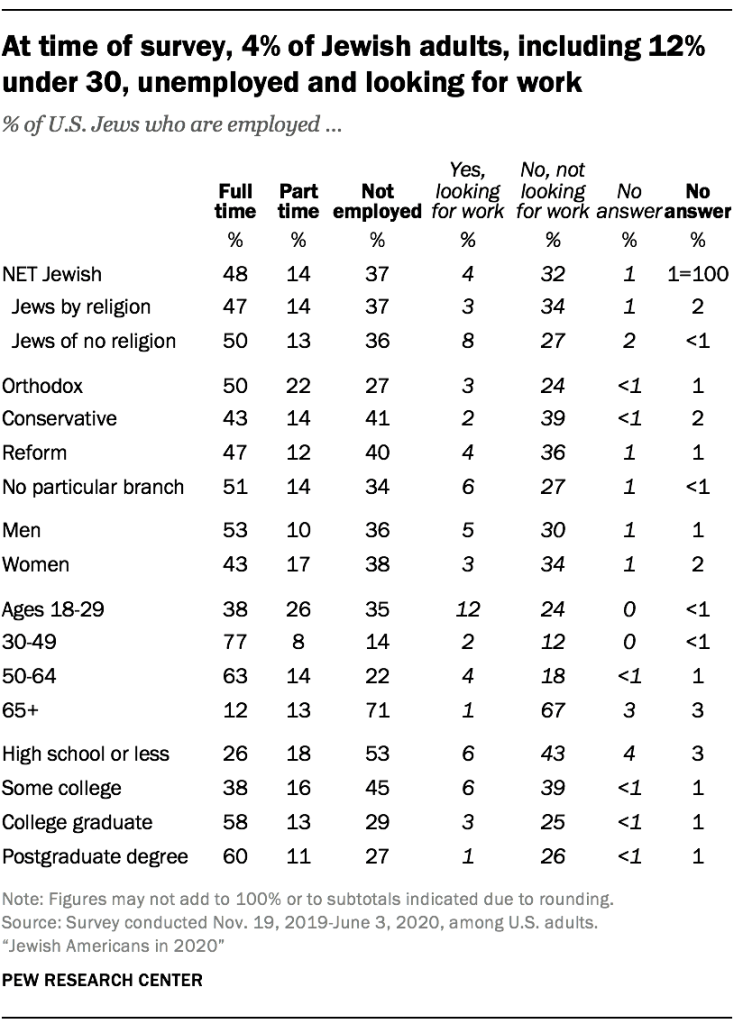
Roughly six-in-ten Jewish adults surveyed (in most cases, prior to the coronavirus pandemic) say they are employed full time (48%) or part time (14%), similar to the share of all U.S. adults working at least part time as of September 2019. Slightly more than one-third of U.S. Jews (37%) are not employed, including 4% who say in the survey that they are looking for work.
Jews ages 30 to 64 and those with a college or postgraduate degree are much more likely to be employed. Among Jewish adults under 30, 12% say they are unemployed and looking for work.
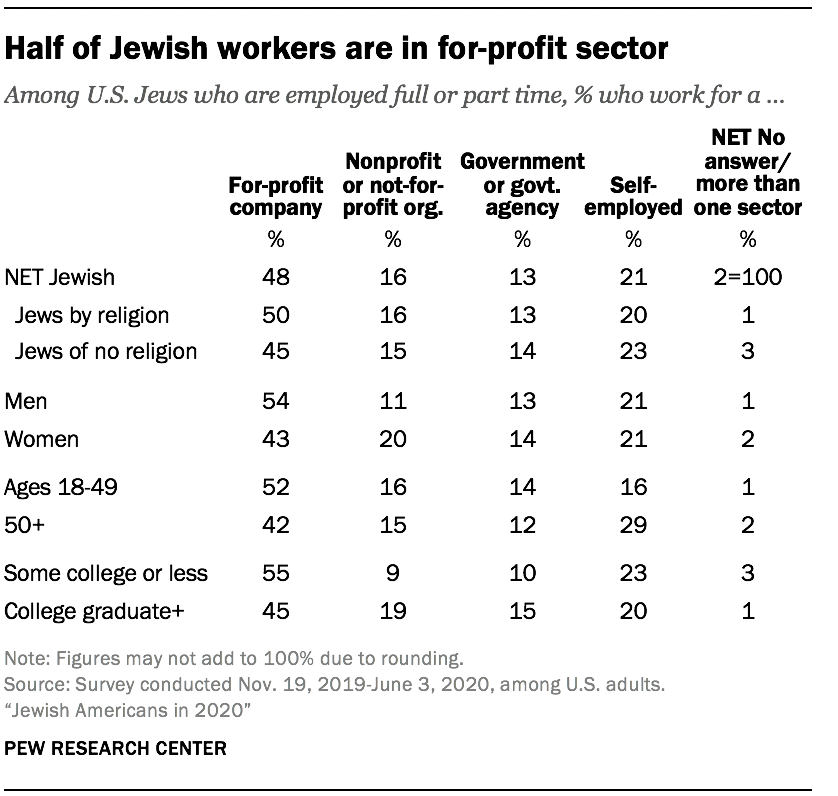
Among U.S. Jews who are employed at least part time, about half (48%) say they work at a for-profit company, while one-in-five (21%) are self-employed, 16% work for a nonprofit organization and 13% work for the government.46
Jewish workers under the age of 50 and those who do not have a college degree are among the most likely to work at a for-profit company, while college graduates are more likely than those without a college degree to work in the nonprofit sector.
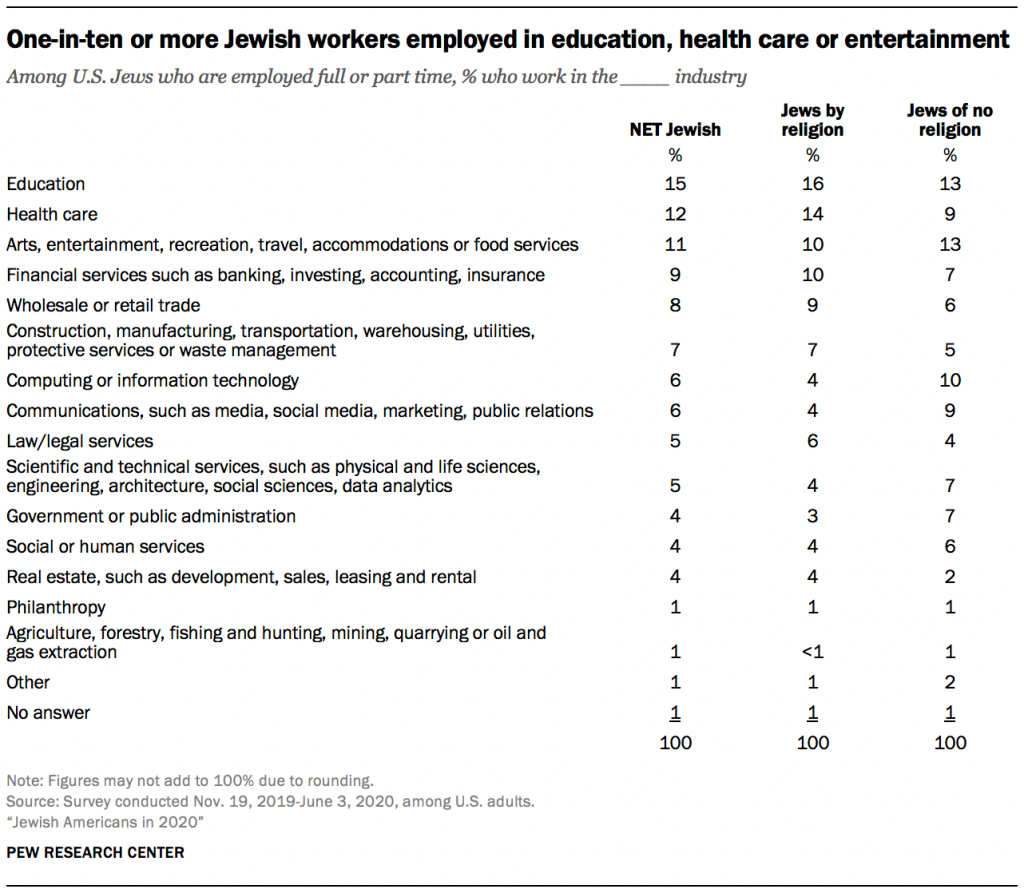
When asked what business or industry they work in, 15% of Jewish respondents say they work in education, 12% say they work in health care, and 11% say they work in the arts, entertainment, recreation, travel, accommodations or food services. An additional 9% of employed Jews work in financial services, 8% in wholesale or retail trade, and 7% in construction, manufacturing, transportation, warehousing, utilities, protective services or waste management.47