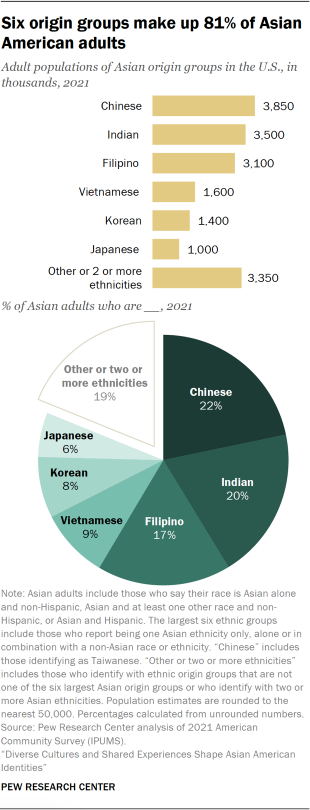
About 17.8 million Asian adults live in the United States, accounting for 7% of the total adult population, according to a Pew Research Center analysis of the 2021 American Community Survey. This population has roughly doubled since 2000, when 8.7 million Asian adults lived in the country.
This demographic profile of Asian Americans focuses on the Asian adult population, matching the population explored by the new survey and report.
Largest origin groups
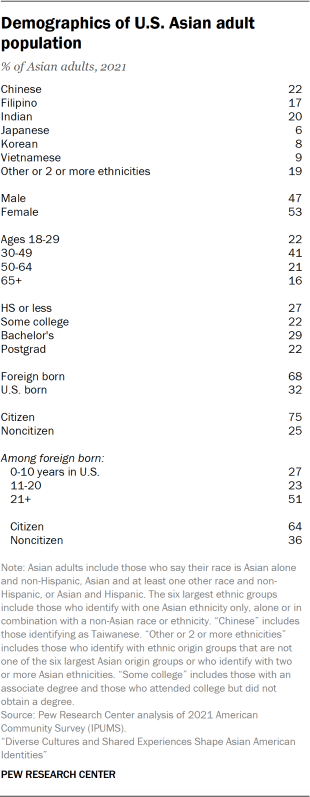
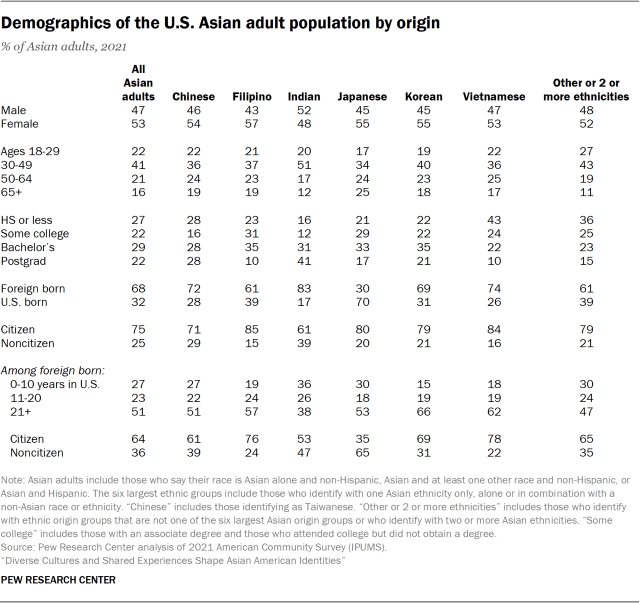
Chinese adults are the largest Asian American ethnic origin group, accounting for 22% of the total Asian adult population.9 They are followed by Indian (20%) and Filipino (17%) adults, each making up roughly one-in-five Asian American adults. Vietnamese (9%), Korean (8%) and Japanese (6%) adults round up the top six largest Asian ethnic origin groups in the U.S. Together, these six groups make up 81% of all Asian American adults.
Age
In 2021, the median age of Asian American adults was 43 years old. Among the largest six Asian ethnic origin groups, Indian adults were the youngest, with a median age of 40 years old. Meanwhile the median age is similar across Chinese (45 years), Filipino (45 years), Korean (45 years) and Vietnamese (46 years) adults. At a median age of 49 years, Japanese adults are the oldest among the largest groups.
Among all U.S. adults, the median age is 47 years old.
Educational attainment
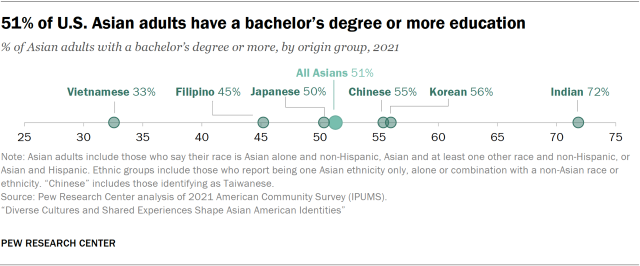
In terms of educational attainment, about half of Asian American adults (51%) had a bachelor’s degree or higher in 2021. Yet there are wide differences in educational attainment by origin groups. Among the largest six origin groups, Indian Americans have the highest educational attainment, with 72% having a college degree or more. More than half of Korean (56%) and Chinese (55%) adults also hold a bachelor’s degree or more, while lower shares of Japanese (50%) and Filipino (45%) do so. And Vietnamese adults (33%) are the least likely of these groups to hold at least a college degree.
By comparison, 32% of all U.S. adults have a bachelor’s degree or more.
Immigration status
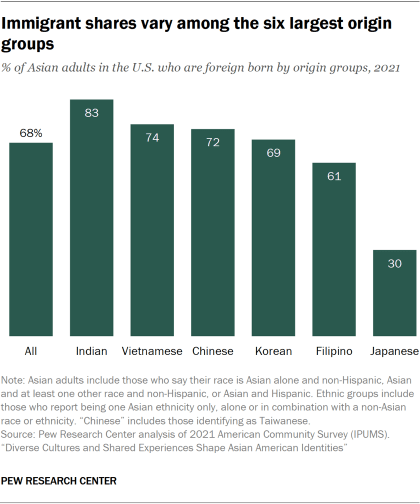
When it comes to nativity, most Asian adults in the U.S. (68%) are immigrants. Among the largest ethnic groups, Indian adults have the highest share who were born abroad (83%), followed by Vietnamese (74%), Chinese (72%), Korean (69%) and Filipino (61%) adults. By contrast, 30% of Japanese adults are immigrants, making them the only group among the largest six to be majority U.S. born (70%).
Among all U.S. adults, 17% are immigrants.
Length of time living in the U.S. among immigrants
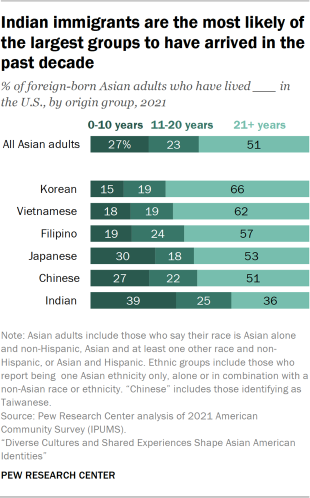
Among immigrant adults, about half (51%) have lived in the U.S. more than 20 years. Roughly one-in-four (27%) arrived in the past 10 years and about 23% have lived in the country between 11 and 20 years.
How long Asian immigrants have lived in the U.S. also varies depending on origin. Roughly two-thirds of Korean immigrant adults (66%) arrived in the U.S. over two decades ago, making them the most likely to be long-term residents among the six largest origin groups. Still, about half or more than half of Vietnamese (62%), Filipino (57%), Japanese (53%) and Chinese (51%) immigrants have been in the country more than 20 years.
On the other hand, Indian adults are the most likely to be recent arrivals. About four-in-ten Indian immigrants (39%) arrived in the U.S. in the past decade, compared with 15% of Korean immigrants – the smallest share among the six largest groups.
Citizenship status among immigrants

In addition, 64% of Asian immigrant adults were naturalized U.S. citizens in 2021. The naturalization rate varies among different origin groups, with Vietnamese adults having the highest percentage of naturalized citizens among the largest six at 78%. Filipino and Korean adults also have relatively high naturalization rates, at 76% and 69% respectively. A smaller share of Chinese immigrant adults (61%) are citizens. Meanwhile, Indian and Japanese immigrant adults have the lowest naturalization rates, at 53% and 35% respectively.
By comparison, 55% of all U.S. immigrants are naturalized citizens.