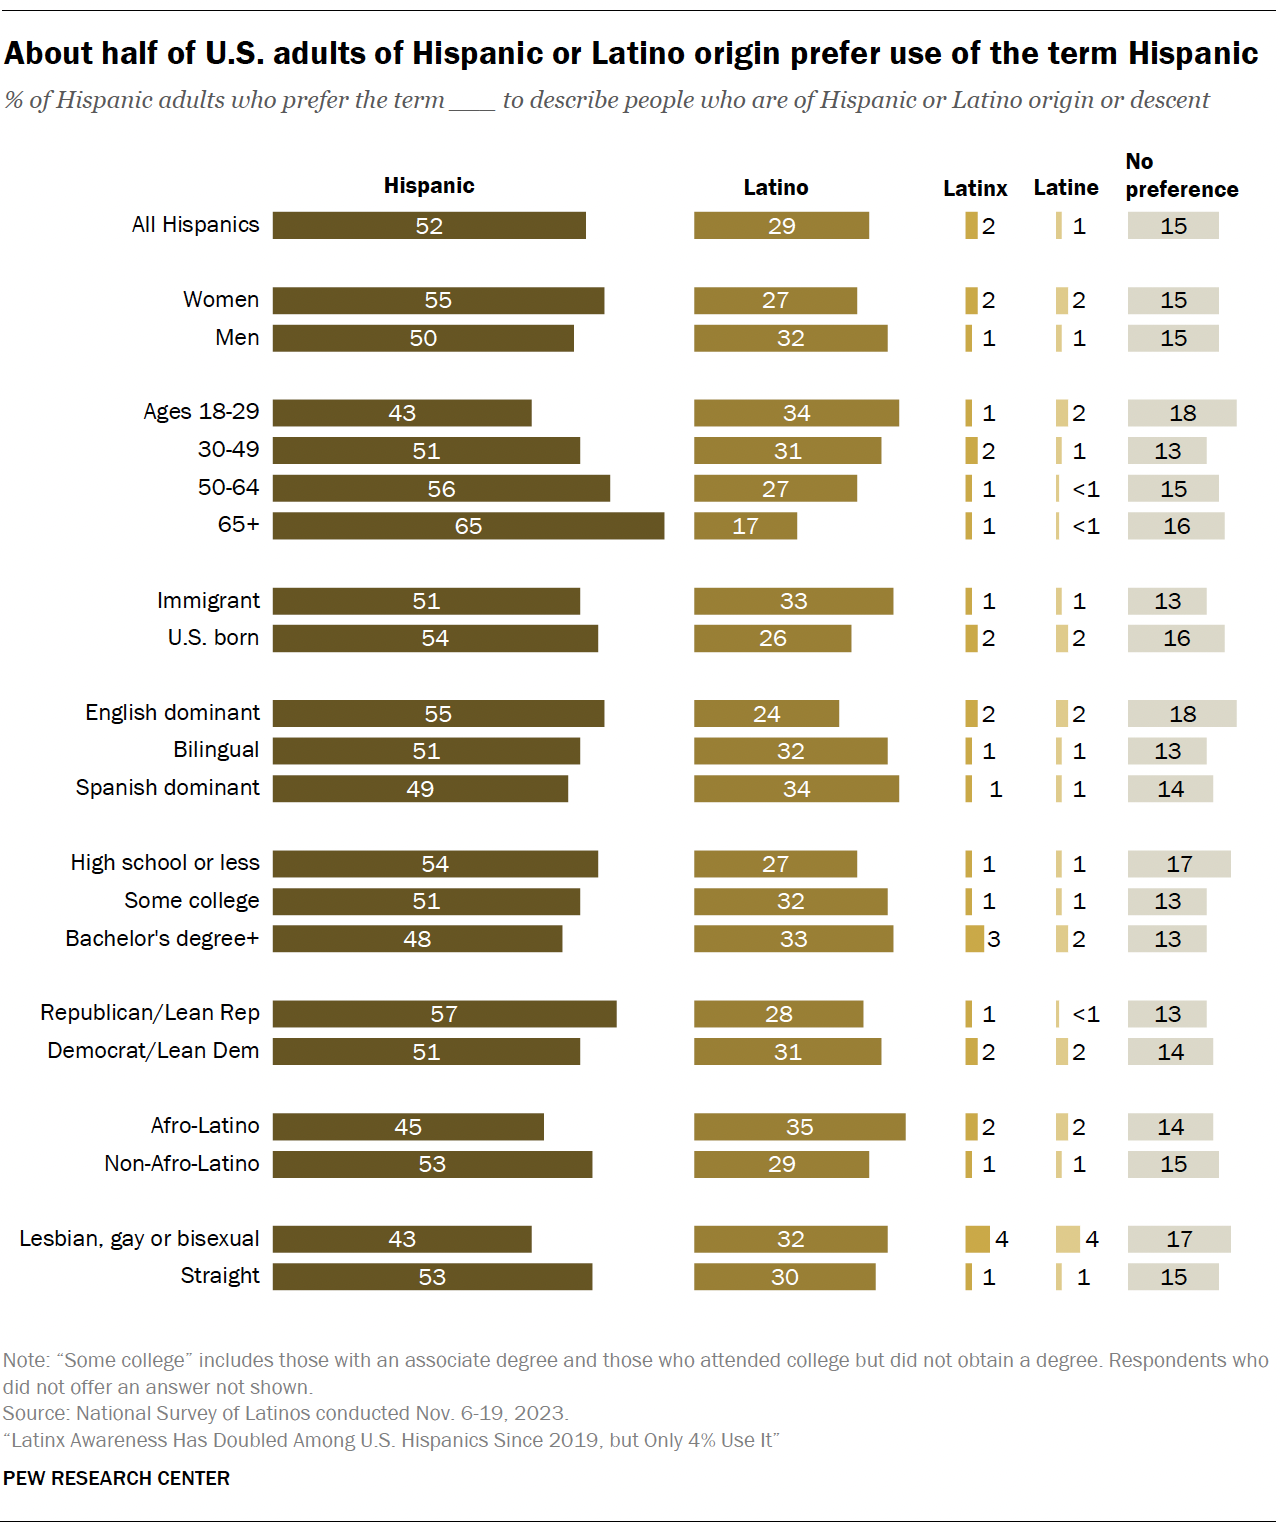
No single pan-ethnic term has been fully embraced by U.S. adults with roots in Latin America or Spain. The more recognized terms Hispanic and Latino have faced their own criticism. Hispanic has been criticized by some for its focus on Spain and Latin America’s colonial past, while Latino has faced backlash for being a gendered term used to describe the entire group.
Still, this population continues to favor the terms Hispanic and Latino over the newer terms Latinx and Latine.6
- 52% prefer the term Hispanic to describe people who are of Hispanic or Latino origin or descent, while 29% prefer the term Latino.
- 2% say they prefer Latinx and 1% favor Latine.
In addition, 15% have no preferred term to describe the U.S. Hispanic or Latino population.
While Hispanic is more popular than other pan-ethnic terms, views on the term among Hispanic adults show a large shift with age. Older adults are more likely than younger adults to prefer it to describe the Hispanic or Latino population. By comparison, the term Latino is more popular among younger adults.
- 65% of adults ages 65 and older say they prefer the term Hispanic, while 43% of adults 18 to 29 say the same.
- 34% of adults ages 18 to 29 prefer the term Latino, compared with 17% among those 65 and older.
Across major demographic subgroups, few Latino adults prefer the more recent gender-neutral pan-ethnic terms Latinx and Latine to describe the population. Notably, 8% of lesbian, gay or bisexual adults prefer Latinx or Latine, while only 2% of straight Latinos say the same.

