
Among all registered voters, preferences for the U.S. House are currently closely divided – and a sizable share of voters say they are uncertain of how they would vote if the election were held today. Four-in-ten registered voters currently support or lean toward the Republican candidate in their district, while about the same share back a Democratic candidate (41%); about two-in-ten registered voters either support another candidate (5%) or are not sure (13%). (Note: The survey question wording included the specific names of the candidates running in a respondent’s congressional district, which is different than how the question was asked earlier in the cycle. See topline for details.)
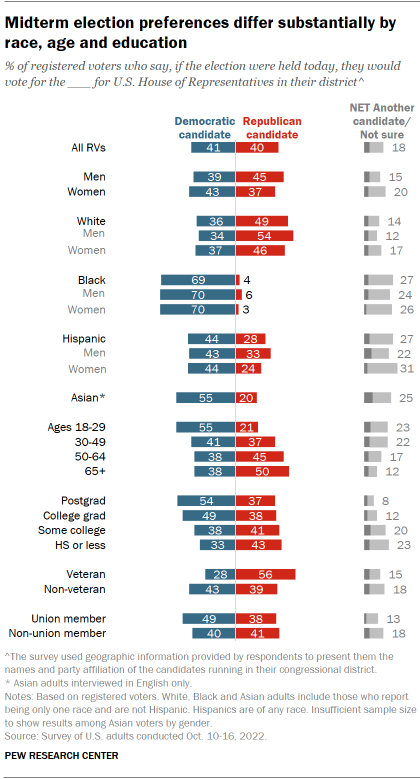
Among all registered voters, more men support the Republican candidate (45%) than the Democratic candidate (39%), while women are somewhat more likely to back the Democratic candidate in their district (43%) over the GOP nominee (37%).
About half of White voters (49%) say they would back the Republican candidate if the election were held today, while 36% would support the Democratic candidate. About seven-in-ten Black voters (69%) support the Democratic candidate; just 4% of Black voters back the Republican. More Hispanic voters back Democrats (44%) than Republicans (28%), while 55% of Asian voters support the Democratic candidates in their districts, and 20% support GOP candidates.
Younger voters continue to be more likely than older voters to back Democratic candidates. Among voters ages 18 to 29, 55% say they prefer the Democrat in their district (21% prefer the Republican). Conversely, voters ages 65 and older are far more likely to support Republican candidates (50%) than Democratic candidates (38%). Voters ages 30 to 49 are about evenly split in who they would vote for if the election were held today (41% would vote for a Democrat and 37% a Republican), while more voters ages 50 to 64 would support a Republican (45%) than a Democrat (38%).
Voters with college degrees favor Democratic candidates over GOP candidates by a sizable margin (51% to 38%). By comparison, voters with a high school diploma or less formal education support Republican candidates over Democratic candidates (43% vs. 33%). Those with some college experience but no degree are narrowly divided: 41% support Republicans and 38% back Democrats.
Military veterans, who represent about one-in-ten voters, support Republicans in their districts over Democrats by two-to-one (56% vs. 28%). Non-veterans are slightly more likely to say they support Democrats than Republicans (43% vs. 39%).
Union members (also about 10% of voters) are more likely to support Democrats than Republicans (49% vs. 38%). Non-union members are about evenly divided in their support (40% say they support Democrats, compared with 41% for Republicans).
Republicans have a modest engagement edge
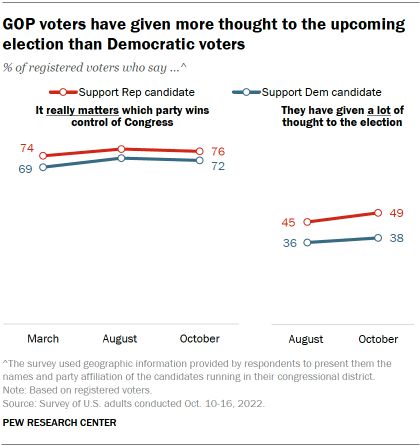
About three-quarters of registered voters who support Republicans (76%), and nearly the same share among those who support Democrats (72%), say it really matters which party wins control of Congress. This is little changed in recent months – and is on par with the shares saying this in the run-up to the 2018 midterm elections (when 74% of Republican supporters and 75% of Democratic supporters said the outcome of that election really mattered).
But GOP voters are substantially more likely to have thought a lot about the upcoming election than Democratic voters: 49% of Republican supporters now say this, up slightly from 45% in August. Among Democratic supporters, 38% say this, little changed from August.
Similar to other recent elections, there are demographic differences in the extent to which registered voters say that they have given a lot of thought to the upcoming elections, are extremely or very motivated to vote and that it really matters which party wins control of Congress.
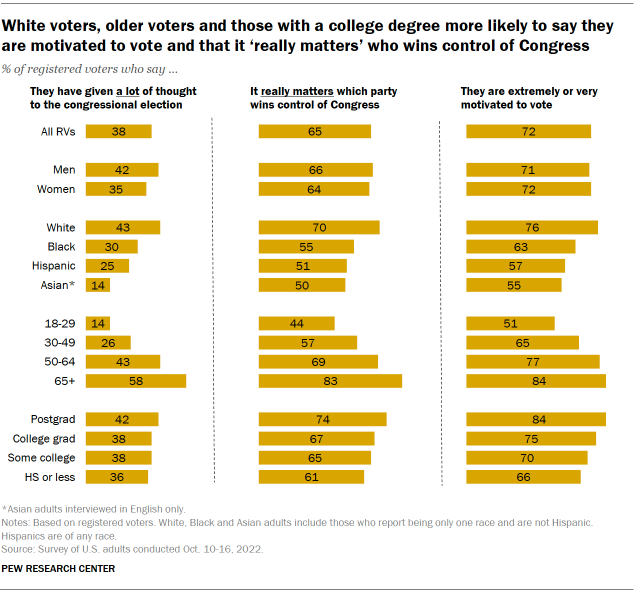
White voters are more likely than Black, Hispanic or Asian voters to say they are motivated to vote, have thought a lot about the upcoming election and to say the outcome of the election really matters. For example, about three-quarters of White voters (76%) say they are extremely or very motivated to vote, compared with 63% of Black voters, 57% of Hispanic voters and 55% of Asian voters.
As is typically the case, older voters are generally more engaged with this election than younger voters. While about half of voters ages 18 to 29 (51%) say they are extremely or very motivated to vote, over eight-in-ten of those ages 65 and older (84%) say this. Compared with voters under age 30, those 65 and older are nearly twice as likely to say that control of Congress really matters (83% vs. 44%) and about four times as likely to say that they have given a lot of thought about the upcoming elections (58% vs. 14%).
Voters with a bachelor’s degree or more are more engaged with this year’s elections than those without a college degree, but these differences are somewhat less stark than differences by race or age. For example, seven-in-ten of voters with at least a bachelor’s degree say control of Congress really matters, compared with 63% of those without a bachelor’s degree.
Men are slightly more likely than women to say they have given a lot of thought to the congressional elections in November (42% vs. 35%). There is essentially no gender gap in the share of voters saying it really matters who wins control of Congress or being extremely or very motivated to vote.
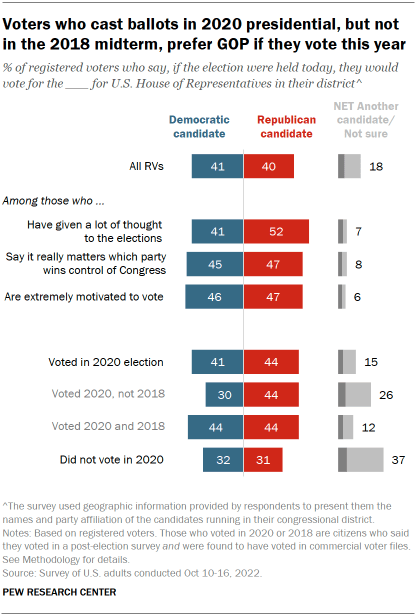
As with registered voters overall, vote preferences among the roughly two-thirds of voters who say it really matters who wins the election are about evenly split – though this group is much less likely than voters overall to say they are not sure of their preferences (47% support Republicans, 45% support Democrats). The congressional contest is similarly divided looking just at the most motivated voters (47% Republican, 46% Democrat).
However, Republican candidates enjoy a clear advantage – 52% vs 41% – among the set of voters who have thought a lot about the election.
Voters who have a validated record of having voted in the 2020 election are about evenly divided between the share who back a Republican candidate (44%) and the share who support a Democrat (41%).
Among 2020 voters, those who also voted in the 2018 midterm elections are equally split between supporting Republicans and Democrats (44% each). But GOP candidates enjoy a 14 percentage point advantage among the subset of voters who cast ballots in 2020 but not 2018 (nearly a quarter of 2020 voters do not have a record of voting in 2018): 44% back GOP candidates, while 30% back Democrats. Another 26% of these 2020-only voters currently either support another candidate or are not sure about their 2020 preferences. Voters who did not vote in 2020 are about as likely to say they are not sure or support another candidate (37%) as to support either party’s nominees (31% prefer Republicans, 32% prefer Democrats). (See Methodology for details on validated voting records).
Top midterm issues: the economy, future of democracy
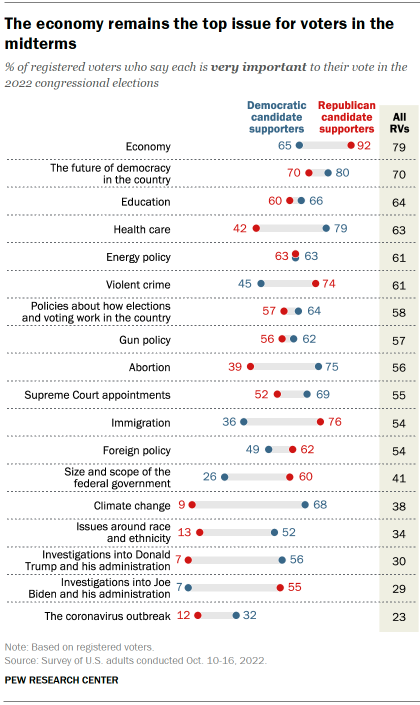
As was the case earlier in the year, the economy remains voters’ top voting issue this year. About eight-in-ten registered voters (79%) say the economy is very important to their vote.
The future of democracy in this country is also among the top issues, with 70% of voters saying it is very important to their vote. Six-in-ten or more mention education (64%), health care (63%), energy policy (61%) and violent crime (61%).
Gun policy (57%) and abortion (56%) also rate as very important issues by majorities of registered voters. Abortion rose in importance as a voting issue earlier in the year but is little changed since August.
While majorities in both parties say the economy is particularly important to their vote, voters who support Republican candidates are significantly more likely to say this (92% say this, compared with 65% of voters supporting Democratic candidates).
Immigration and violent crime are also top issues among GOP voters: About three-quarters of Republican voters cite immigration (76%) or violent crime (74%) as very important issues to their vote. Democratic voters are much less likely to say either is a very important issue to their vote.
By contrast, the top issues for Democratic voters this fall include the future of democracy in this country (80% say this is very important to their vote), health care (79%) and abortion (75%). And while Republican voters are only somewhat less likely than Democratic voters to say the future of democracy is a very important issue to their vote (70%), fewer than half say health care (42%) or abortion (39%) are very important to their vote.
Climate change also rates highly for Democratic voters; about two-thirds (68%) say it is very important to their vote, compared with only 9% of Republican voters who say the same.
A modest majority of those who support Democratic candidates (56%) say investigations into Donald Trump and his administration are very important to their vote this fall, while just 7% of those who back Republicans say the same. Yet the pattern is reversed when it comes to investigations into Joe Biden and his administration: 55% of Republican voters say these are very important to their vote, while only 7% of Democratic voters say this.
As has been the case throughout this year, the coronavirus outbreak ranks near the bottom of voters’ issue priorities. About a quarter of voters (23%) say it is very important to their vote, with Democratic voters more likely to say this than Republican voters (32% vs. 12%). The importance attached to COVID-19 as a voting issue has declined over the course of the year. A third of voters said the coronavirus outbreak was very important to their vote in March.
Wide partisan divides in voters’ attitudes, beliefs
Republican and Democratic voters are deeply divided in attitudes and beliefs on a range of subjects, encompassing race, government regulation of business, foreign policy and even whether society can be thought of as divided between good and evil.
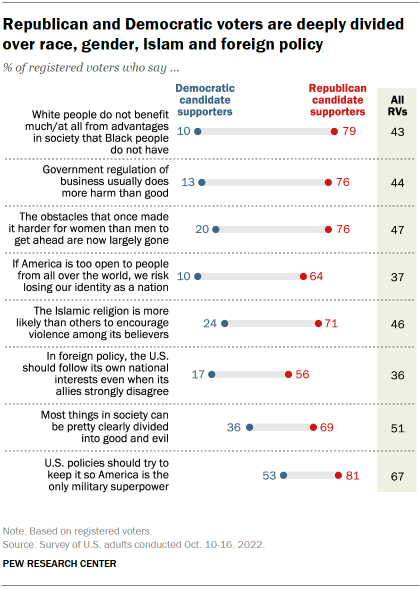
A large majority of registered voters who support Republican candidates (79%) say White people receive little or no benefit from societal advantages that Black people do not have, including 36% who say White people get no benefit at all from such advantages. Just 10% of voters who support Democratic candidates share this view; 60% say White people benefit a great deal from advantages that Black people lack, while 29% say they benefit a fair amount.
The differences are nearly as pronounced in views of the impact of government regulation on business and whether women continue to face obstacles because of their gender.
The partisan divide on obstacles to women’s progress is nearly symmetrical: 76% of Republican voters say the obstacles that once made it harder for women than men to get ahead are largely gone. Among Democratic voters, 79% say these obstacles still exist, and just 20% say they have disappeared.
Differences over foreign policy are not quite as large. Republican voters are 39 percentage points more likely to say the United States should follow its own national interests even when allies strongly disagree (56% vs. 17%), and 28 points more likely to say U.S. policies should ensure America’s role as the lone military superpower (81% vs. 53%).
There has long been a deep partisan divide in views of whether Islam is more likely than other religions to promote violence. In the current survey, 71% of voters who back Republican candidates say Islam is more likely to promote violence, compared with 24% of voters who support Democrats.
Whether America’s openness to people from around the world is essential to the nation’s identity – or whether too much openness risks its identity – also divides Republican and Democratic voters. And, more fundamentally, they differ over whether “most things in society can be clearly divided between good and evil.”
About seven-in-ten Republican voters (69%) subscribe to this viewpoint. Far fewer Democratic voters (36%) concur, with a majority saying most things are “too complicated” to be divided into good and evil.
Biden’s job rating more negative than positive in most demographic groups
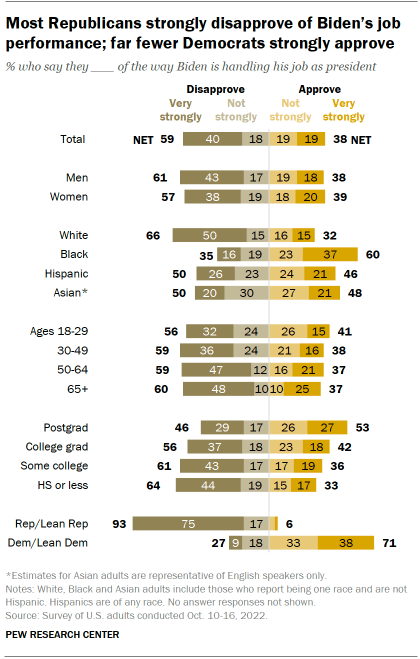
A majority of U.S. adults (59%) say they disapprove of the way Biden is handling his job as president, including 40% who say they very strongly disapprove. Fewer (38%) say they approve of Biden’s job performance, with 19% saying they very strongly approve.
The public’s approval ratings of Biden’s job performance are comparable to those of Donald Trump at a similar point in his presidency, but remain lower than some other recent presidents over the last four decades. (For more on historical presidential approval ratings, see “Biden’s job rating is similar to Trump’s but lower than that of other recent presidents.”)
There are few differences on approval of Biden’s presidency by gender and age. However, there is more variation across other demographic groups.
Black adults stand out for their approval of Biden’s job as president: Six-in-ten say they approve of the way Biden is handling his job as president. Hispanic and Asian adults are more divided in their opinions of Biden’s job as president (46% and 48% say they approve of Biden’s job as president, respectively).
By contrast, about two-thirds of White adults (66%) say they disapprove of how Biden is handling his presidency, compared with just 32% who approve.
While majorities of adults with a bachelor’s degree (56%), some college experience (61%) or a high school diploma or less education (64%) say they disapprove of Biden’s job as president; those with a postgraduate degree are more divided in their opinions (53% approve, 46% disapprove).
Views of Biden’s job as president are also widely divided by partisanship, with Republicans holding deeply negative views of Biden in the presidency role. Republicans and GOP leaners overwhelmingly disapprove of Biden’s job as president: 93% hold this view, including three-quarters who strongly disapprove of Biden’s job as president. Only 6% of Republicans approve of Biden’s job as president.
By contrast, about seven-in-ten Democrats and Democratic-leaning independents (71%) say they approve of Biden’s presidency, with 38% who strongly approve – roughly half the share of Republicans who strongly disapprove.


