
The American Trends Panel survey methodology
The American Trends Panel (ATP), created by Pew Research Center, is a nationally representative panel of randomly selected U.S. adults. Panelists participate via self-administered web surveys. Panelists who do not have internet access at home are provided with a tablet and wireless internet connection. Interviews are conducted in both English and Spanish. The panel is being managed by Ipsos.
Data in this report is drawn from the panel wave conducted July 27 to Aug. 2, 2020. A total of 11,001 panelists responded out of 14,407 who were sampled, for a response rate of 76%. This does not include 10 panelists who were removed from the data due to extremely high rates of refusal or straightlining. The cumulative response rate accounting for nonresponse to the recruitment surveys and attrition is 4.2%. The break-off rate among panelists who logged on to the survey and completed at least one item is 1.3%. The margin of sampling error for the full sample of 11,001 respondents is plus or minus 1.5 percentage points.
A portion of this report comes from data from the set of panelists who responded to both this wave and to a previous wave conducted Nov. 7 to 16, 2018. A total of 7,651 panelists responded to both waves. The margin of sampling error for these 7,651 panelists is plus or minus 1.7 percentage points.
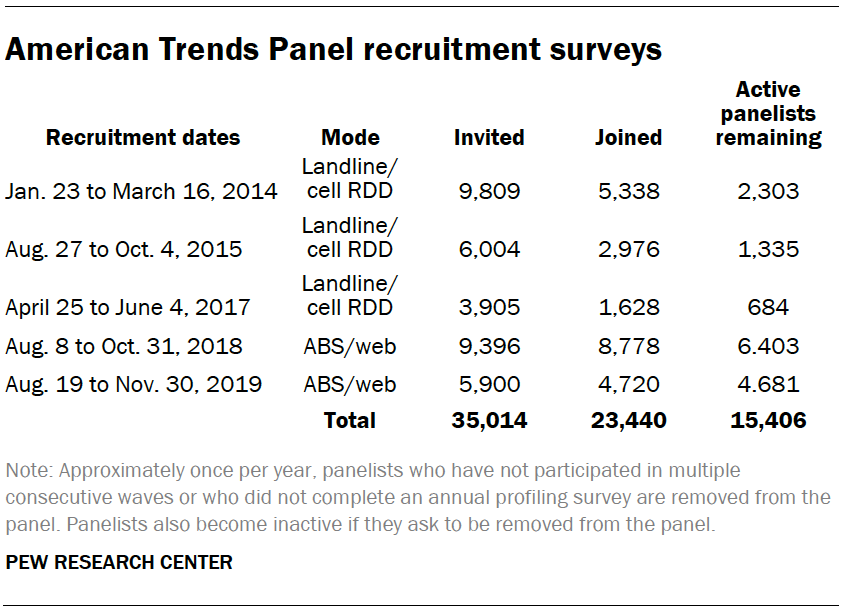
The ATP was created in 2014, with the first cohort of panelists invited to join the panel at the end of a large, national, landline and cellphone random-digit-dial survey that was conducted in both English and Spanish. Two additional recruitments were conducted using the same method in 2015 and 2017, respectively. Across these three surveys, a total of 19,718 adults were invited to join the ATP, of which 9,942 agreed to participate.
In August 2018, the ATP switched from telephone to address-based recruitment. Invitations were sent to a random, address-based sample (ABS) of households selected from the U.S. Postal Service’s Delivery Sequence File. In each household, the adult with the next birthday was asked to go online to complete a survey, at the end of which they were invited to join the panel. For a random half-sample of invitations, households without internet access were instructed to return a postcard. These households were contacted by telephone and sent a tablet if they agreed to participate. A total of 9,396 were invited to join the panel, and 8,778 agreed to join the panel and completed an initial profile survey. The same recruitment procedure was carried out on August 19, 2019, from which a total of 5,900 were invited to join the panel and 4,720 agreed to join the panel and completed an initial profile survey. Of the 23,440 individuals who have ever joined the ATP, 15,406 remained active panelists and continued to receive survey invitations at the time this survey was conducted.
The U.S. Postal Service’s Delivery Sequence File has been estimated to cover as much as 98% of the population, although some studies suggest that the coverage could be in the low 90% range.2 The American Trends Panel never uses breakout routers or chains that direct respondents to additional surveys.
Weighting
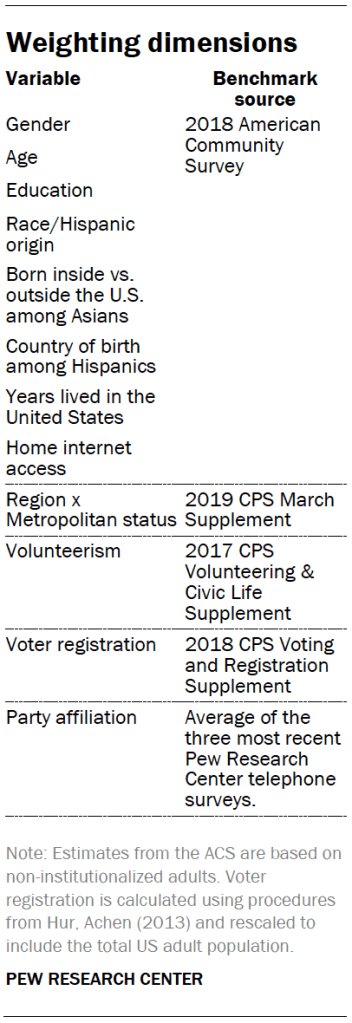
The ATP data was weighted in a multistep process that begins by calibrating the entire panel so that it aligns with the population benchmarks identified in the accompanying table to create a full-panel weight. For ATP waves in which only a subsample of panelists are invited to participate, a wave-specific base weight is created by adjusting the full-panel weights for subsampled panelists to account for any differential probabilities of selection for the particular panel wave. For waves in which all active panelists are invited to participate, the wave-specific base weight is identical to the full-panel weight. The next step in the weighting uses an iterative technique that aligns the sample to population benchmarks on the dimensions listed in the accompanying table.
Analyses of the 7,651 panelists who responded to both this wave and the Nov. 2018 wave incorporate a weight that additionally aligns the smaller sample to the weighted proportion of all 11,001 respondents to this wave who supported Trump, Biden, neither, or were not registered voters.
Sampling errors and test of statistical significance take into account the effect of weighting.
In addition to sampling error, one should bear in mind that question wording and practical difficulties in conducting surveys can introduce error or bias into the findings of opinion polls.
The following table shows the unweighted sample sizes and the error attributable to sampling that would be expected at the 95% level of confidence for different groups in the survey:
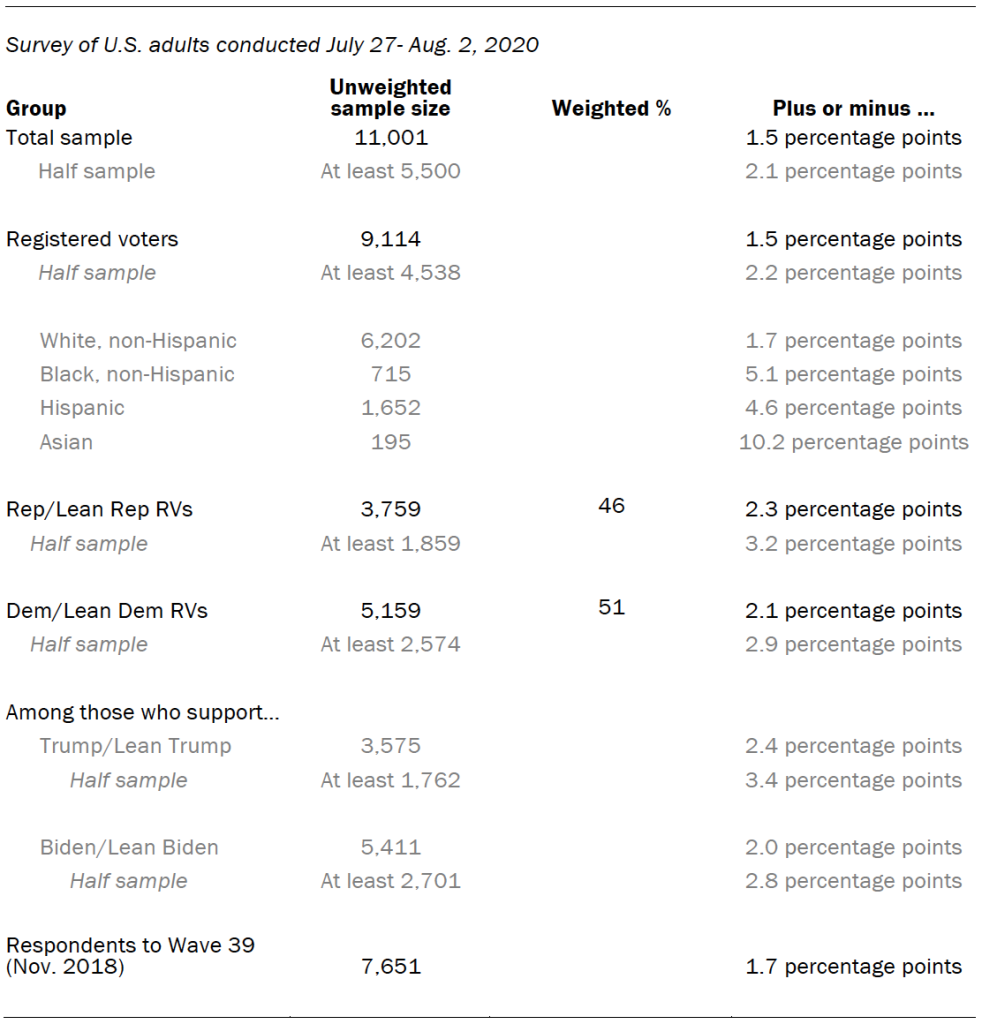
Sample sizes and sampling errors for other subgroups are available upon request.
Survey conducted July 23-Aug. 4, 2020, via telephone
The analysis in this report is based on telephone interviews conducted July 23-Aug. 4, 2020, among a national sample of 1,750 adults, 18 years of age or older, living in all 50 U.S. states and the District of Columbia (350 respondents were interviewed on a landline telephone, and 1,400 were interviewed on a cell phone, including 955 who had no landline telephone). The survey was conducted by interviewers under the direction of Abt Associates. A combination of landline and cell phone random digit dial samples were used; both samples were provided by Dynata. Interviews were conducted in English and Spanish. Respondents in the landline sample were selected by randomly asking for the youngest adult male or female who is now at home. Interviews in the cell sample were conducted with the person who answered the phone, if that person was an adult 18 years of age or older. The weighting procedure corrected for the different sampling rates. For detailed information about our survey methodology, see http://www.pewresearch.org/methodology/u-s-survey-research/.
The combined landline and cellphone sample is weighted using an iterative technique that matches gender, age, education, race, Hispanic origin and nativity and region to parameters from the Census Bureau’s 2018 American Community Survey one-year estimates and population density to parameters from the decennial census. The sample also is weighted to match current patterns of telephone status (landline only, cell phone only, or both landline and cell phone), based on extrapolations from the 2019 National Health Interview Survey. The weighting procedure also accounts for the fact that respondents with both landline and cell phones have a greater probability of being included in the combined sample and adjusts for household size among respondents with a landline phone. The margins of error reported and statistical tests of significance are adjusted to account for the survey’s design effect, a measure of how much efficiency is lost from the weighting procedures.
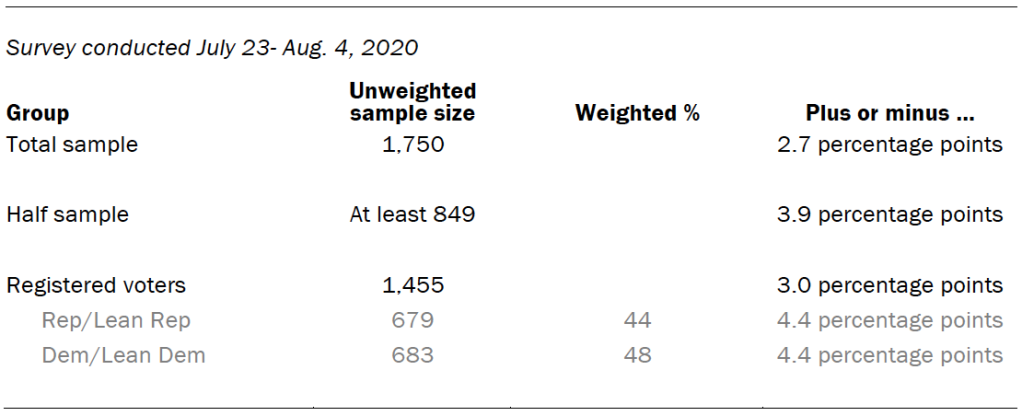
Sample sizes and sampling errors for other subgroups are available upon request.
© Pew Research Center, 2020
CORRECTION (September 2020): A previous version of this methodology statement contained an incorrect description of the base weighting for this survey. None of the study findings or conclusions are affected.
