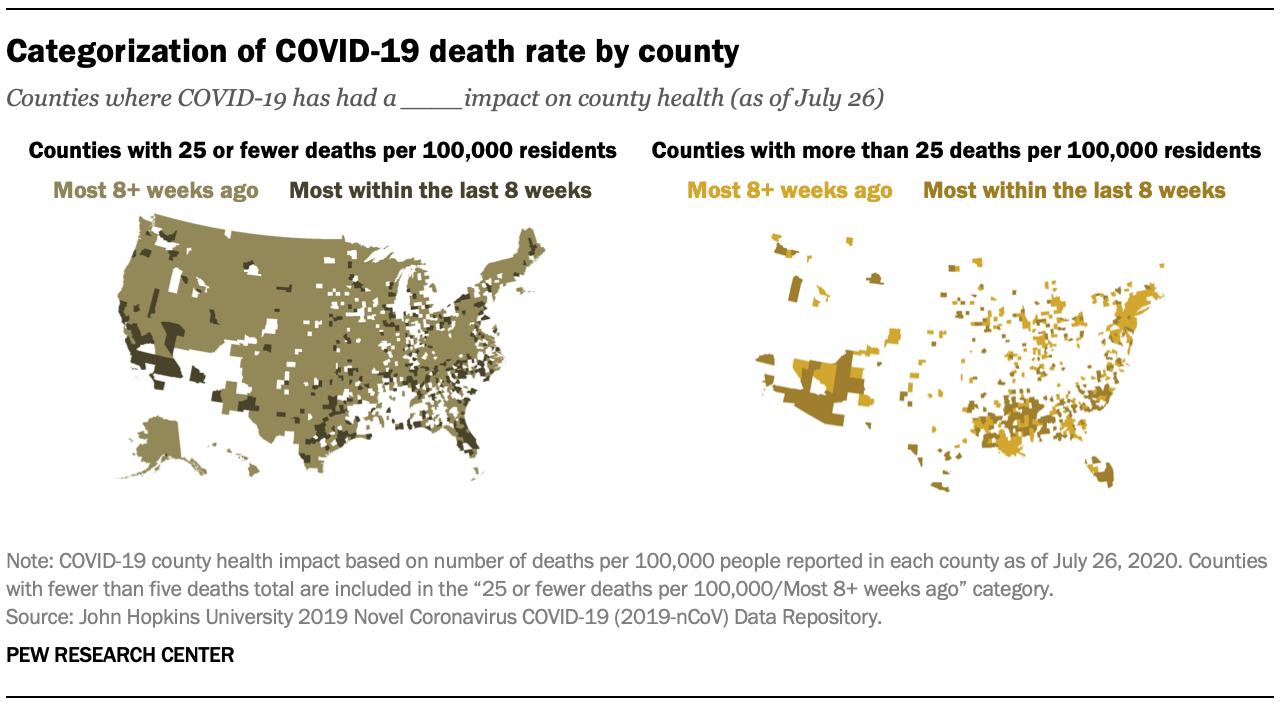
This report uses the number and timing of deaths attributed to COVID-19 in each respondent’s county as a measure of the scale of the health impact of the outbreak for each individual in the survey. These numbers are then adjusted for differences in county population (per 100,000 residents). Counties are categorized as having a higher or lower rate of COVID-19 deaths. In addition to the number of deaths in the county, counties were classified according to when the majority of deaths occurred (either in the past eight weeks or prior to the past eight weeks).
Counties are classified as “higher” if they had more than 25 deaths per 100,000 people as of July 26, 2020. “Lower” counties had 25 or fewer deaths per 100,000 people. Counties that have recorded fewer than five deaths overall since the beginning of the pandemic are classified as “Lower/prior to the past 8 weeks.”
Data for deaths attributed to COVID-19 by county are taken from the 2019 Novel Coronavirus COVID-19 (2019-nCoV) Data Repository maintained at John Hopkins University (downloaded on Aug. 3, 2020). These data are supplemented with data from the New York City Health Department (also downloaded on Aug. 3) to break out the individual boroughs within New York City, which are not reported separately in the Johns Hopkins data. Similarly, data from New York Times coronavirus reporting (also downloaded Aug. 3) is used to separate out Rhode Island counties that are not separately reported by Johns Hopkins.