For the past few decades, telephone survey researchers have faced increasing difficulty contacting Americans and getting reluctant people to cooperate. Surveyors also face the challenge of adequately covering the U.S. population at a time of growing cell phone use. More than a third of households can be reached only on a cell phone, thus making it essential to include cell phone numbers in all surveys.5
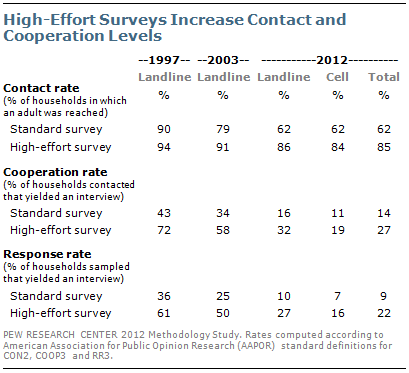
The Pew Research standard 5-day survey, employing techniques commonly used by many opinion polling organizations, obtained interviews in just 9% of sampled households. This response rate is comparable to other Pew Research polls in 2012, and is similar to the rates obtained by other major political and media survey organizations. Over the past 15 years, response rates have declined steadily, from 36% in 1997 to 25% in 2003 and 15% in 2009.
These declines result from the increasing difficulty in making contact with someone in a household, as well as in gaining cooperation once contact is made. The standard survey made contact with 62% of households, down from 72% of households in 2009, 79% in 2003 and 90% in 1997.
Among contacted households in 2012, just 14% yielded a completed interview with an adult, lower than in 2009 (21%) and far lower than in 2003 (34%) and 1997 (43%). Some of this decline is due to the inclusion of cell phones, given the fact that people reached by cell phones cooperate at lower rates than those reached by landline (11% vs. 16%). The greater reluctance of cell phone owners to consent to an interview will likely be a growing problem for surveys as the share of interviews completed on a cell phone increases.
When additional efforts are utilized, a higher response rate can be achieved. Households in the high-effort survey were contacted over an extended field period with far more call attempts (up to a maximum of 25 calls for landline numbers and 15 calls for cell phone numbers over two and a half months for the high-effort survey vs. a maximum of 7 calls over 5 days for the standard survey) and received incentives to participate (ranging from $10-$20). Households where address information could be obtained were also sent letters encouraging them to respond to the survey. In addition, elite interviewers, who have many interviewing hours and are particularly skilled at persuading reluctant respondents, were deployed later in the field period to further increase the cooperate rate.
Although participation among cell respondents can be increased through the use of incentives and elite interviewers, there are limitations on the ability to increase participation by increasing the number of call attempts. In addition, cell phone respondents cannot be reached via traditional mail because their numbers cannot be linked with an address.
The additional techniques used to increase participation resulted in a 22% response rate, compared with just 9% in the standard survey. The high-effort survey succeeded in making contact with far more households than the standard survey (85% vs. 62%). The additional efforts also improved the cooperation rate from 14% to 27%.
The high-effort survey obtained a response rate that was far lower than was achieved with additional efforts in 2003 (50%) and 1997 (61%). Because the high-effort survey achieved a response rate of only 22%, there is a greater potential for it to be affected by non-response bias, since about three-in-four households are still not represented in the survey.
Samples Still Representative
Despite the growing difficulties in obtaining a high level of participation in most surveys, well-designed telephone polls that include landlines and cell phones reach a cross-section of adults that mirrors the American public, both demographically and in many social behaviors.
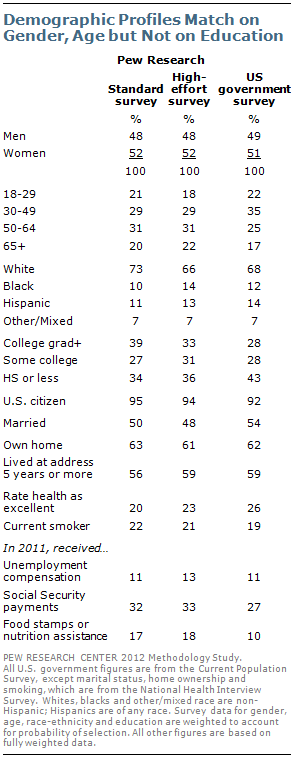
The profile of survey respondents in a standard Pew Research survey generally matches that obtained from high response rate and government surveys when it comes to gender, age, race, citizenship, marital status, home ownership and health status. Telephone surveys have traditionally under-represented young people and minorities, but the inclusion of cell phone interviews improves the overall representativeness of telephone surveys.
As has long been true, one of the largest differences between standard survey samples and the full population is on educational attainment – 39% of respondents in the standard survey say they graduated from college. That compares with 28% of adults in the Current Population Survey. Those with a high school education or less were under-represented in the survey (34% in the standard survey vs. 43% in the Current Population Survey).
The additional techniques used to encourage participation in the high-effort survey improved the representativeness of the survey sample on some variables. For example, the racial composition and educational attainment of people interviewed in the high-effort survey are somewhat closer to the government benchmarks than in the standard survey. However, the high-effort survey actually yields a larger percentage of older respondents than the standard survey and is even further from the government parameter. In addition, estimates of receiving various types of government assistance and current smoking status from the high-effort survey are not any closer to the national parameters in the high-effort survey.
Comparison of Standard and High-Effort Survey Responses
Overall, there are only modest differences in responses between the standard and high-effort surveys. Similar to 1997 and 2003, the additional time and effort to encourage cooperation in the high-effort survey does not lead to significantly different estimates on most questions.
The majority of questions (28 of 40) show a difference of two points or less between the standard and high-effort surveys; the median difference is two points. However, on seven questions, there are statistically significant differences between the two surveys. In particular, there are differences in views about government, attitudes about immigrants, political engagement and how often people go out in the evenings.
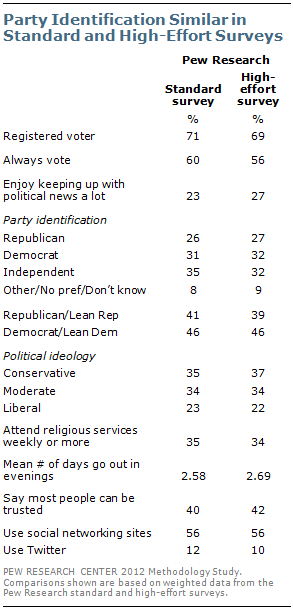
There are no significant differences between the surveys on party identification, leaned party identification or political ideology. The share of people who say they are registered to vote also is similar in both surveys (71% in standard survey vs. 69% in high-effort survey).
Registered voters in the standard survey are more likely to say they always vote (60% standard vs. 56% high-effort), whereas respondents in the high-effort survey are more likely to say that they “enjoy keeping up with political news” a lot (27% vs. 23%).
There are few differences on a variety of measures of social integration and community engagement.
Respondents in the standard survey are more likely than those in the high-effort survey to say they do not typically go out at all during an average week (20% vs. 16%). Respondents in the standard survey go out a mean number of 2.58 days, compared with a mean of 2.69 days for people in the high-effort survey. This indicates that people who are less frequently at home had a better chance of being contacted in the high-effort survey, in which more calls were placed to their households over a longer period of time than in the standard survey.
On measures of social trust there are no significant differences between the standard and high-effort surveys. Similarly, comparable percentages in both surveys say they use social networking sites and Twitter.
Both surveys asked respondents several questions about their political values. There are no significant differences on views about homosexuality, racial discrimination or Wall Street’s impact on the economy, but there are significant differences on views about government and immigration. In the standard survey, 39% favor a bigger government providing more services over a smaller government providing fewer services; that compares with 43% in the high-effort survey. Respondents in the high-effort survey are slightly more likely to say that immigrants today strengthen the country because of their hard work and talents (52% vs. 48% in the standard survey).
Effects of Over-Representing Volunteers
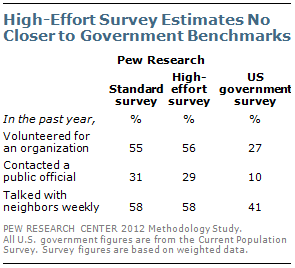
The additional methods used to increase participation in the high-effort survey do not significantly improve estimates of volunteering, contacting a public official or talking with neighbors, when compared with the government benchmarks. A majority (56%) of respondents in the high-effort survey say they volunteered for an organization in the past year, which is virtually the same percentage as in the standard survey (55%) and much higher than the 27% in the Current Population Survey.
Similarly, the estimates of the number who have contacted a public official in the past year are no closer to the government benchmark than those in the standard survey (29% vs. 10% in the Current Population Survey). And in both surveys, 58% say they talked with neighbors at least once in the past week, compared with 41% in the Current Population Survey.
For all these comparisons, the question wording is nearly identical to the government surveys and the differences are likely, at least partly, a result of non-response bias. But the context in which the questions are asked could not be replicated exactly and may have contributed to some of the differences observed.
Although the Pew Research surveys produce much higher incidences of volunteerism and contact with a public official, the demographic characteristics of those who say they have volunteered and contacted a public official in the past year are similar to those obtained in the Current Population Survey.
While there are large differences between volunteers and non-volunteers on many questions in the survey, the analysis indicates that this over-representation of volunteers does not introduce substantial biases into the survey, especially on political measures.
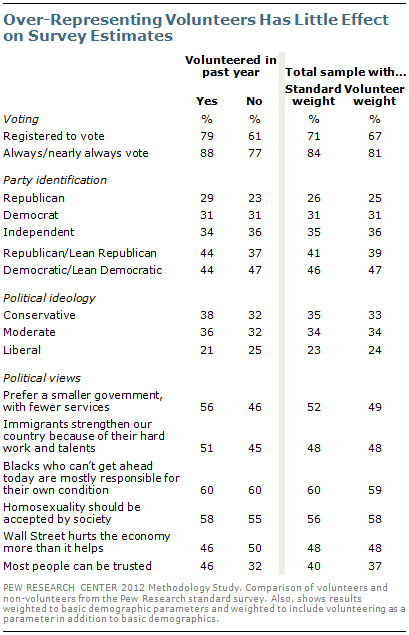
To analyze how the survey estimates might be affected if volunteers were not over-represented, the survey data were re-weighted so that along with the standard demographic weighting, the percentage of volunteers matched the proportion in the Current Population Survey.
This re-weighting has very little impact on the survey estimates, including on estimates of voter registration, party identification and ideology, or on any of the other political views tested.
For example, while volunteers are much more likely than non-volunteers to be registered to vote (79% vs. 61%), there is only a four point difference in the overall voter registration estimate between the standard weighting and the volunteer weighting. Similarly, while Republicans and Republican leaners make up a larger share of volunteers than non-volunteers (44% vs. 37%), the volunteer-weighted estimate of the Republican share is only two points lower than the standard weighting (39% vs. 41%).
A majority of volunteers say they prefer a smaller government with fewer services (56%), compared with 46% among non-volunteers. But the volunteer-weighted estimate of this attitude (49%) differs by only three percentage points from the standard-weighted estimate (52%). There are no significant differences between volunteers and non-volunteers, nor the reweighted estimates, on views of immigrants, homosexuality, racial discrimination or Wall Street.
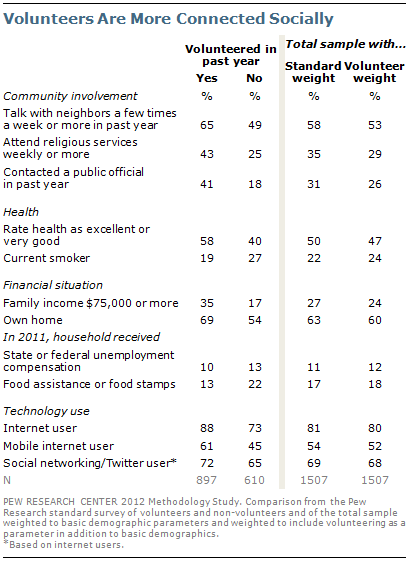
There are only a few questions on which the re-weighted estimates are significantly different from the standard weighting. These include the frequency of talking with neighbors, church attendance, contacting a public official and frequency of voting. For all of these questions, the alternative weighting reduced the frequency of these behaviors.
Among voters, volunteers are somewhat more likely than non-volunteers to say they always or nearly always vote (88% vs. 77%). In the re-weighted data, these frequent voters comprise a slightly smaller share of the total (81%) than in the standard weighting (84%).
Volunteers are far more likely than non-volunteers to talk with their neighbors in the past week (65% vs. 49%), attend religious services at least weekly (43% vs. 25%) and twice as likely to have contacted a public official in the past year (41% vs. 18%). The re-weighting of the data lowered the estimate of talking with neighbors and contacting a public official by 5 percentage points (bringing both closer to the government benchmark), and the percentage of weekly attendance at religious services by 6 points.


