With Internet use skyrocketing in virtually every major demographic group, more than one-third of Americans (36%) are now going online from work or home. What’s more, those who go online have a large appetite for news and information and are turning to the Internet as yet another news source.

The Internet is quickly becoming a part of American daily life. A quarter of the public (25%) went online from home or work yesterday, a sharp increase from the 4% who did so three years ago. To put this in perspective, almost as many people use the Internet on a typical weekday as spend time reading a magazine (29%).
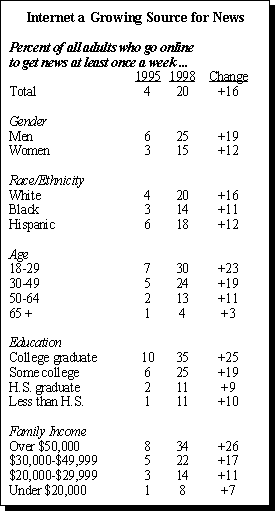
Although Americans turn to the Internet for all types of information, the number of people going online for news is up dramatically. In 1998, 20% of Americans are getting online news at least once a week, up from just 6% two years ago and 4% in 1995.1 As with Internet use overall, the number of Americans who go online to get news regularly is up by 10 to 20 percentage points across nearly all major demographic groups. In fact, in most demographic groups there are more people now going online for news every day than were going online for news at least once a week in 1995.
Those who go online for news are disproportionately younger, better-educated and affluent. More than one-third of college graduates (35%) — and 47% of college graduates who are under age 30 — get news online at least once a week. Similarly, 34% of those earning over $50,000 a year go online to get news at least weekly.
Internet users are a news-hungry group. Fully 66% of those who go online for news say they follow national news most of the time, compared to just 47% of those who do not use a computer. Consequently, the Internet is emerging as a supplement to — not a substitute for — other traditional news sources.
Just 11% of those who go online for news say they are now using other news sources less often. More than half of Internet users (54%) say they have gone online to get more information about a story they first saw or heard about from a more traditional news source.
Those who get online news regularly are just as likely as those who do not get online news to watch the nightly network news, CNN or other cable news channels, once factors such as age and education are taken into account.2
Those who get news online do not spend any less time in a typical weekday reading a newspaper or watching television news. In fact, those who go online for news tend to spend more time than those who do not reading a newspaper or watching television news, again when age and educational differences are taken into account.
Information Overload Not A Problem
Not surprisingly, the Internet audience is comfortable with today’s news environment, which like the Internet itself, offers a seemingly endless stream of information and choices. More than three-in-four Internet users (77%) say they like having access to so much information, compared to 58% of Americans who do not use a personal computer. In contrast, fewer than 20% of Internet users feel “overloaded” with information, compared to 35% of non-computer users.
Americans who go online also place a slightly higher priority than non-computer users on getting news that is timely and up-to-date, and Internet users care less about having news delivered in an entertaining or caring manner. For example, 29% of non-computer users rank “enjoyable and entertaining” as extremely important news qualities, compared to just 15% of those who go online. Similarly, 21% of non-computer users rank news that “stirs your emotions” as very important, compared to 9% of Internet users.

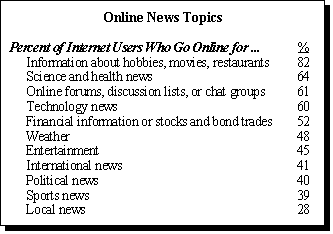
Although the Internet is often a source of information on entertainment and leisure activities, several news topics are also big draws. For example, more than 60% of Internet users go online for news about health, science and technology. More than half (52%) go online to get financial information or to trade stocks or bonds.


