Pew Research Center’s annual National Public Opinion Reference Survey (NPORS) has measured partisan affiliation among U.S. adults since 2020. Explore recent patterns of partisan affiliation in the American public and among several key demographic groups below.
About partisan affiliation measures in Pew Research Center data
This fact sheet shows trends in partisan identification among U.S. adults using data from Pew Research Center’s National Public Opinion Reference Survey (NPORS). The most recent NPORS was conducted from Jan. 30 to June 18, 2026, among 5,511 U.S. adults.
We field NPORS to produce benchmark estimates for several topics, including Americans’ political and religious affiliations. The accompanying NPORS fact sheet provides additional detail about its methodology, including the questionnaires and links to the datasets.
We also periodically publish reports that analyze partisan affiliation trends in more depth (including longer-term trends and additional subgroup analysis), based on data from Pew Research Center’s American Trends Panel and historical trends from Center telephone surveys. The most recent of these reports – focused on partisanship among registered voters – was published in spring 2024.
Political party affiliation, 2020-26
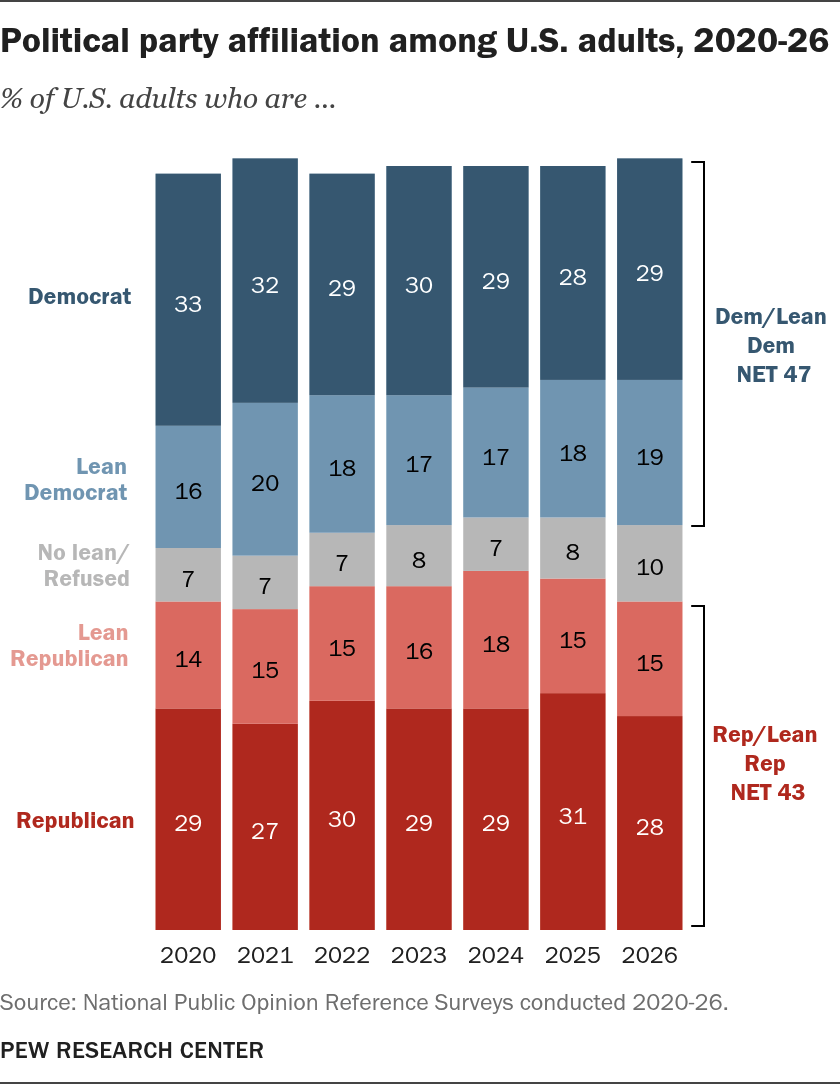
Democrats have a narrow advantage over Republicans in partisan affiliation among U.S. adults: 47% identify with or lean toward the Democratic Party, and 43% identify with or lean toward the Republican Party.
The Democratic Party’s modest edge is similar to where it was in 2020, the last year of President Donald Trump’s first term. But this is a shift from the last few years (from 2022-2025 the public was about evenly split).
The Democratic Party’s advantage is primarily due to an edge among “leaners” – people who do not identify as partisans, but do express a leaning toward one of the two parties:
Overall, 29% of Americans call themselves Democrats, while 28% call themselves Republicans.
An additional 19% lean toward the Democratic Party, while 15% lean toward the Republican Party.
Why leaners are included with partisans
While a majority of Americans consider themselves to be a partisan – either a Republican (28%) or a Democrat (29%) – 44% of adults say they are independents or “something else.” Most of those who do not identify with a party say they lean toward one of the two parties, with 15% of all adults leaning Republican and 19% leaning Democratic. These leaners’ political views and behaviors tend to align much more closely with those of the partisans they lean toward than with those of independents who lean toward the other party.
Throughout this fact sheet, references to Republicans and Democrats include those who lean toward that party.
Political party affiliation among U.S. adults, 2020-26
% of U.S. adults who are …
Source: National Public Opinion Reference Surveys conducted 2020-26.
PEW RESEARCH CENTER
Share this chart
Political party affiliation among U.S. adults, 2020-26
Source: National Public Opinion Reference Surveys conducted 2020-26.
PEW RESEARCH CENTER
Partisanship by gender
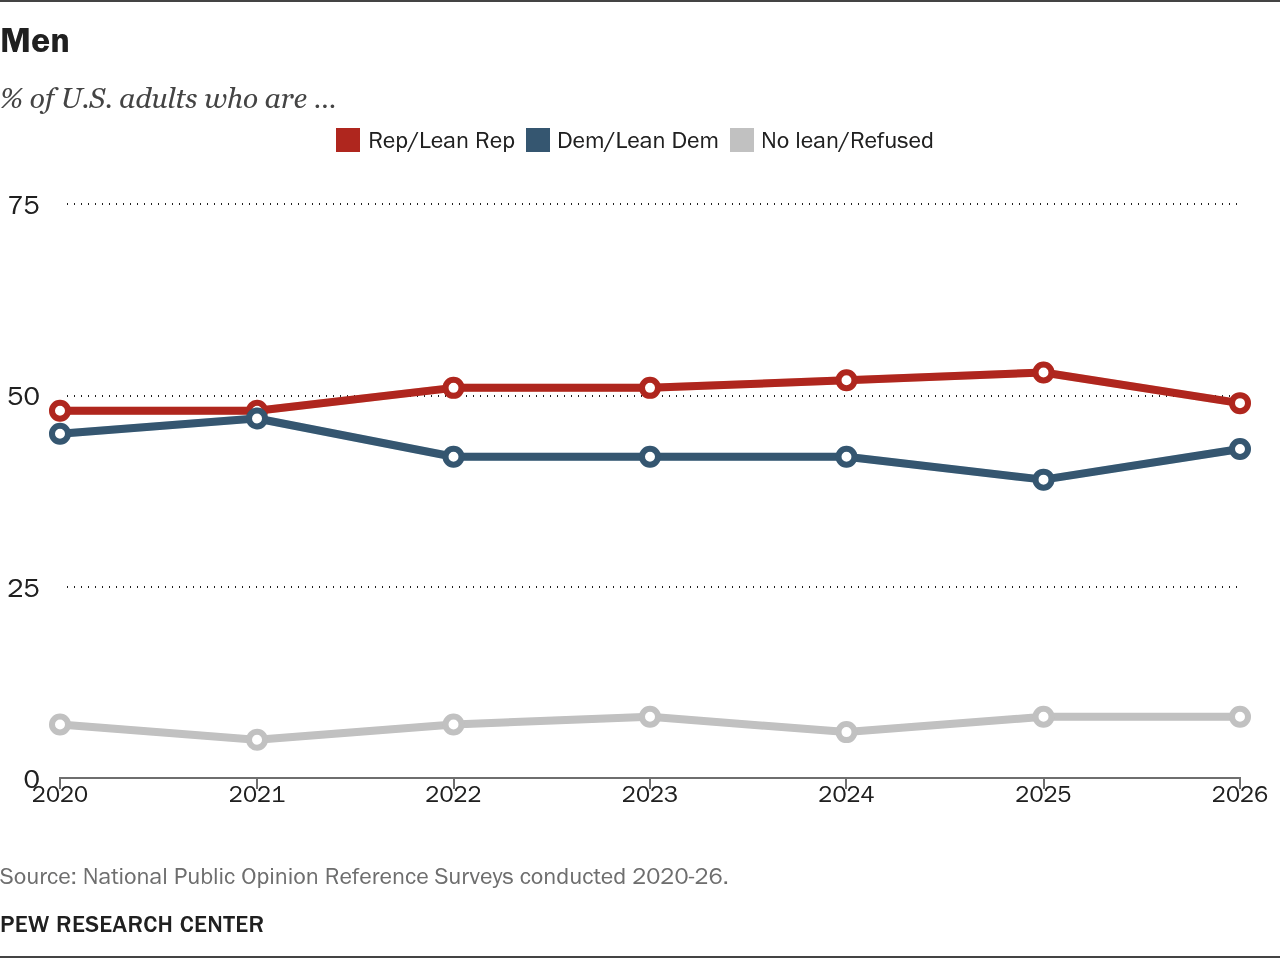
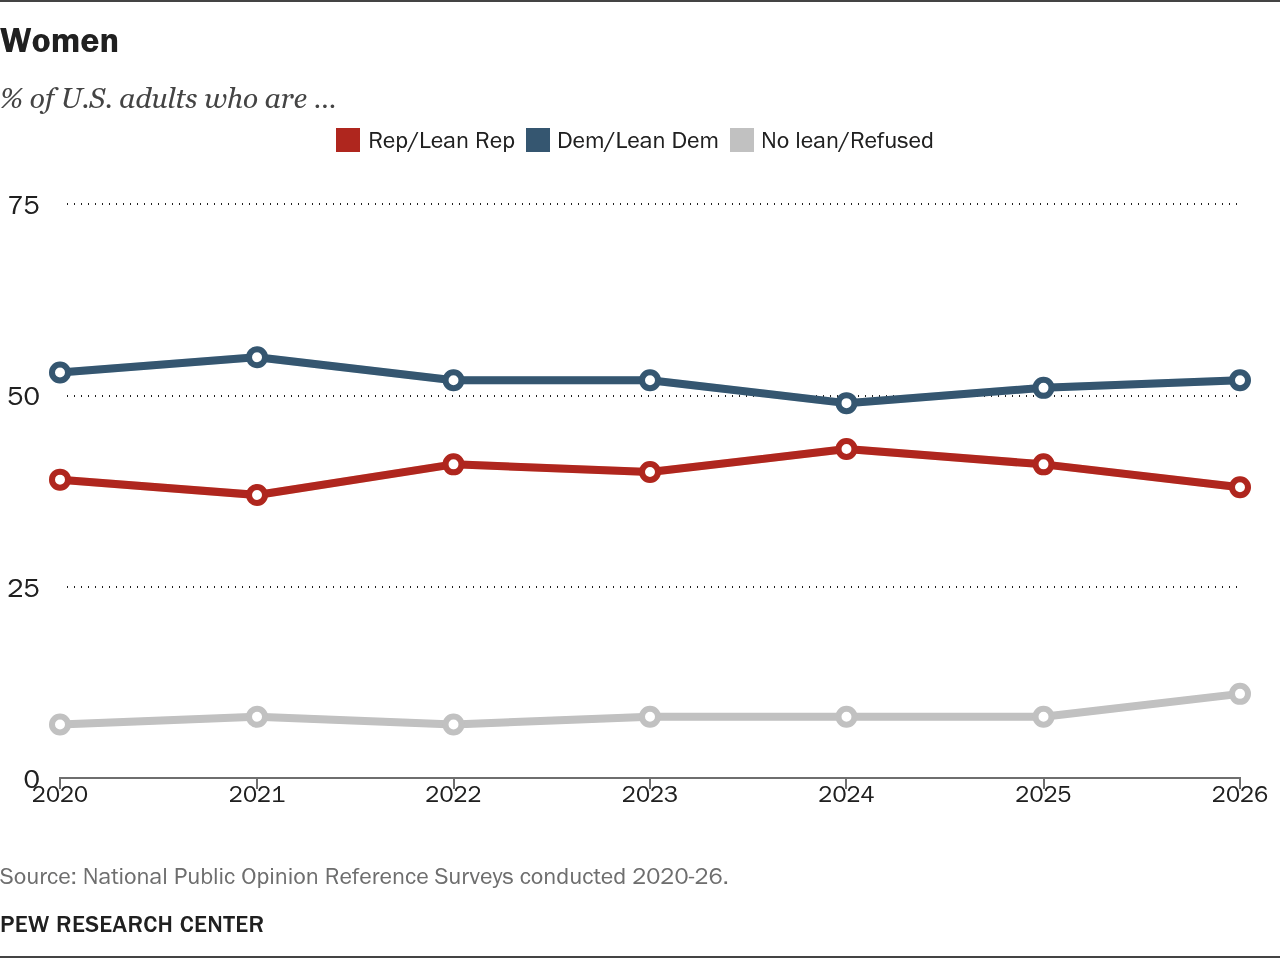
The long-standing gender gap in partisan identification has been fairly consistent in recent years. Today, men are 11 percentage points more likely than women to affiliate with the Republican Party. Conversely, women are 9 points more likely than men to affiliate with the Democratic Party. The Republican Party’s 6-point advantage among men today is narrower than the advantage it held from 2022 to 2025 though it remains wider than it was in 2020 and 2021.
Men
% of U.S. adults who are …
Source: National Public Opinion Reference Surveys conducted 2020-26.
PEW RESEARCH CENTER
Share this chart
Men
% of U.S. adults who are …
Year
Rep/Lean Rep
Dem/Lean Dem
No lean/Refused
2026
49
43
8
2025
53
39
8
2024
52
42
6
2023
51
42
8
2022
51
42
7
2021
48
47
5
2020
48
45
7
Source: National Public Opinion Reference Surveys conducted 2020-2026.
Source: National Public Opinion Reference Surveys conducted 2020-26.
PEW RESEARCH CENTER
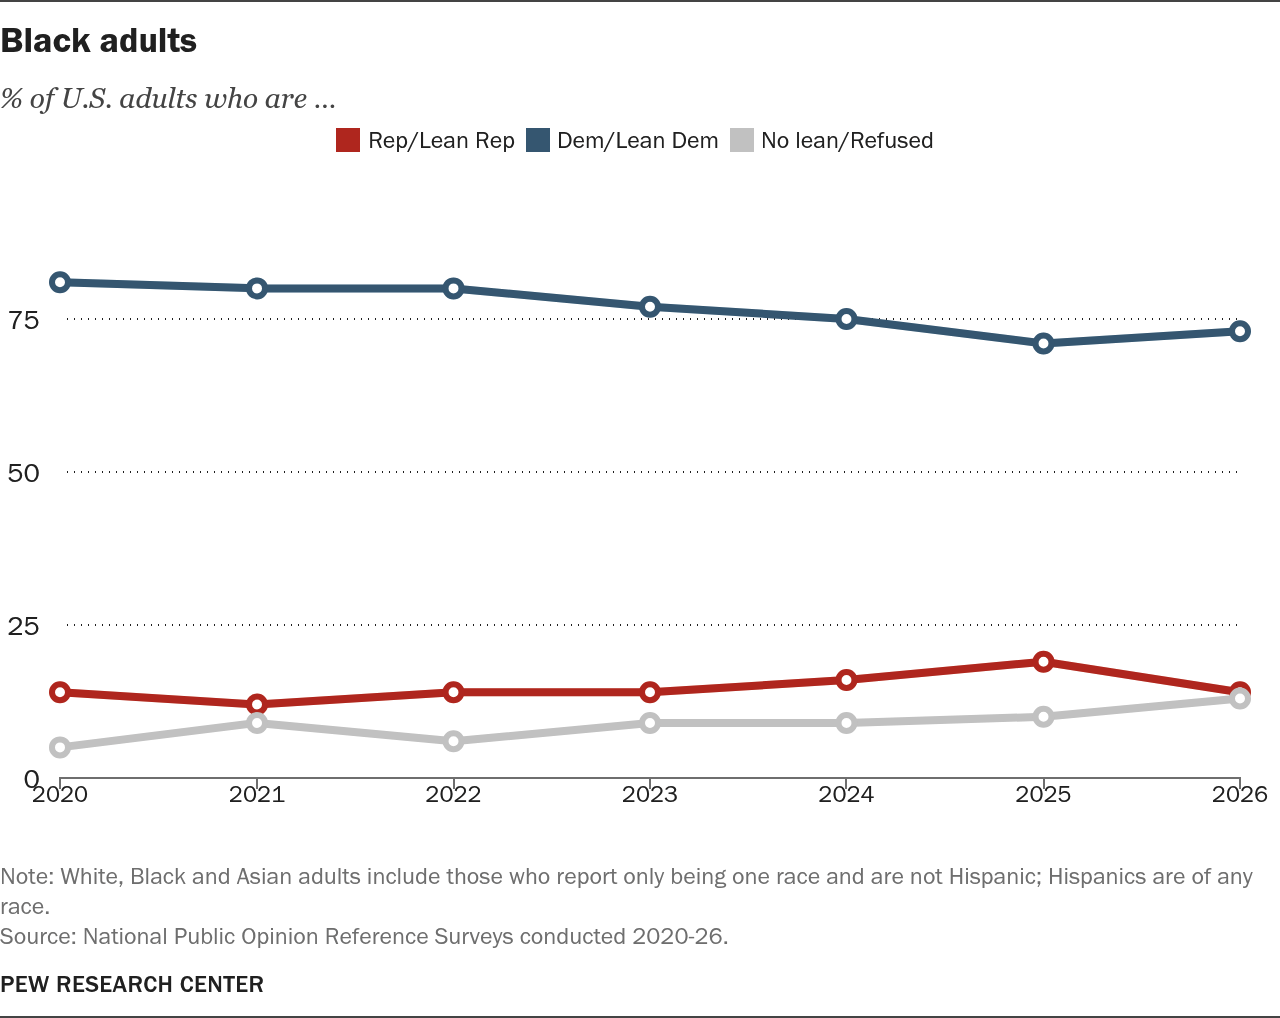
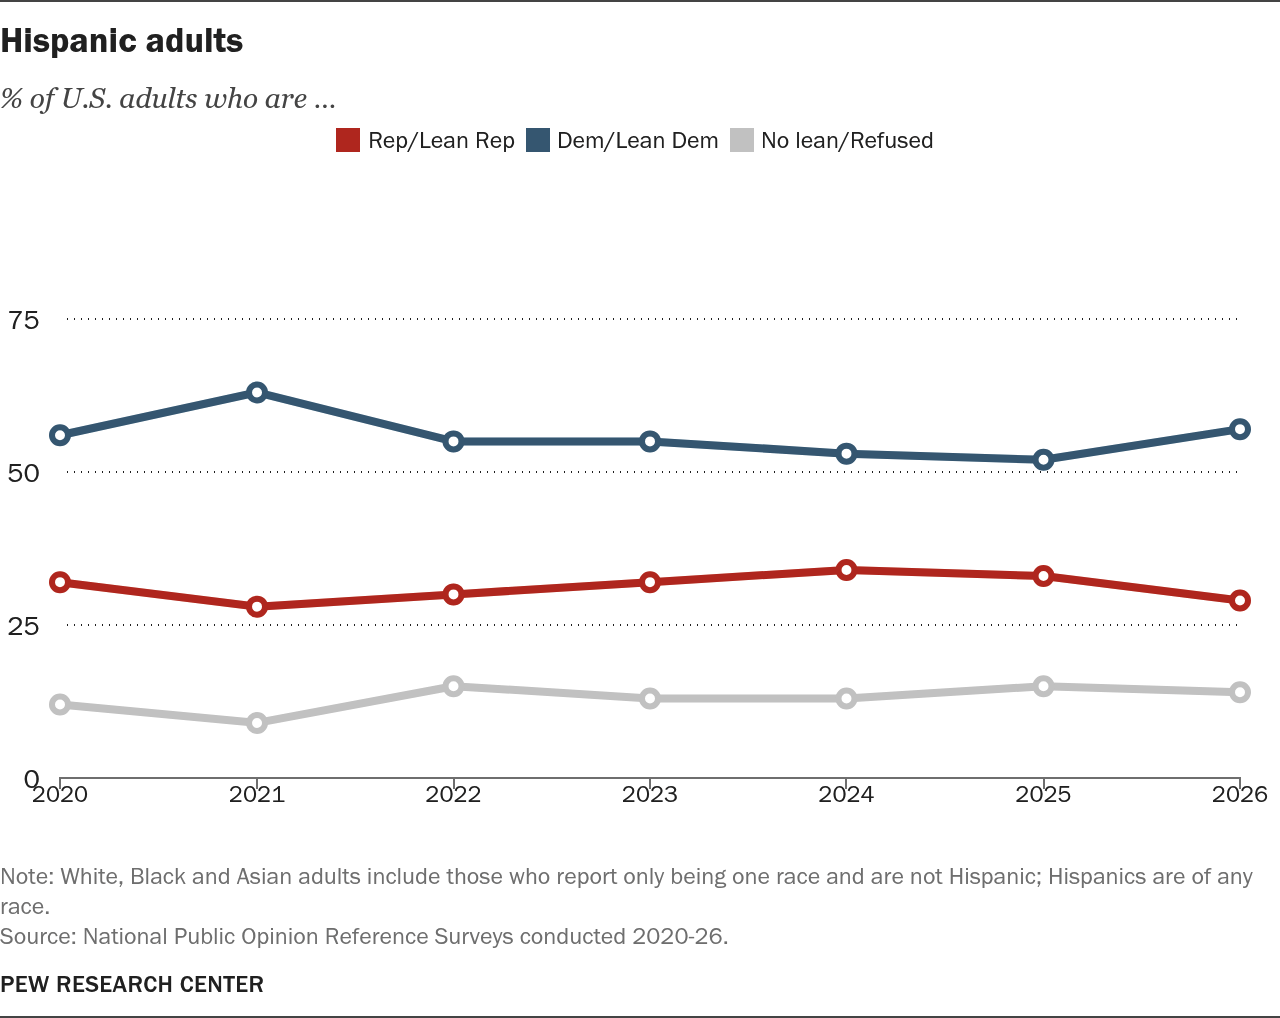
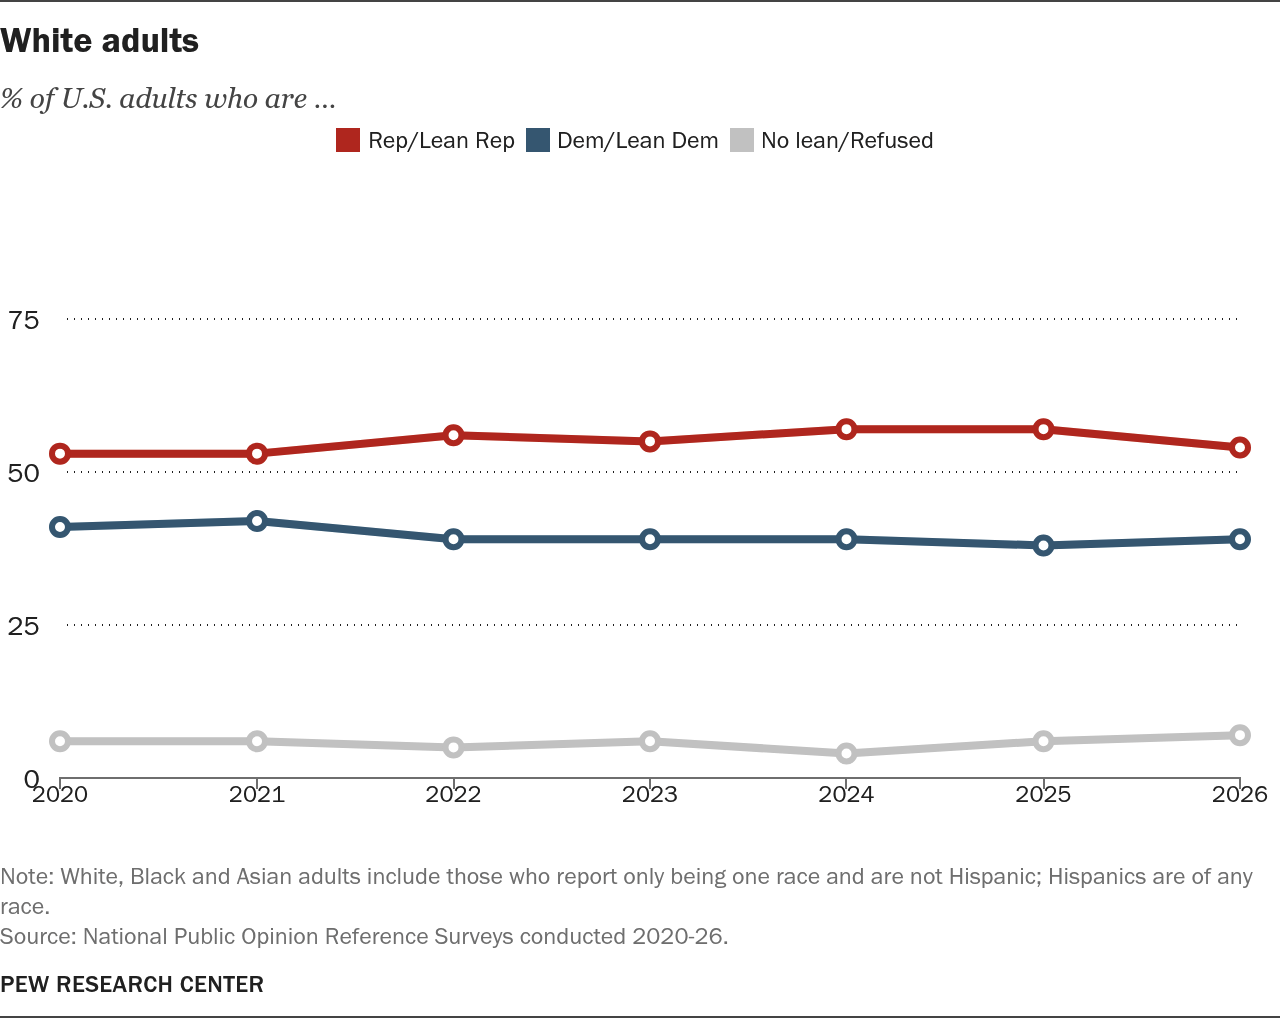
Partisanship by race and ethnicity
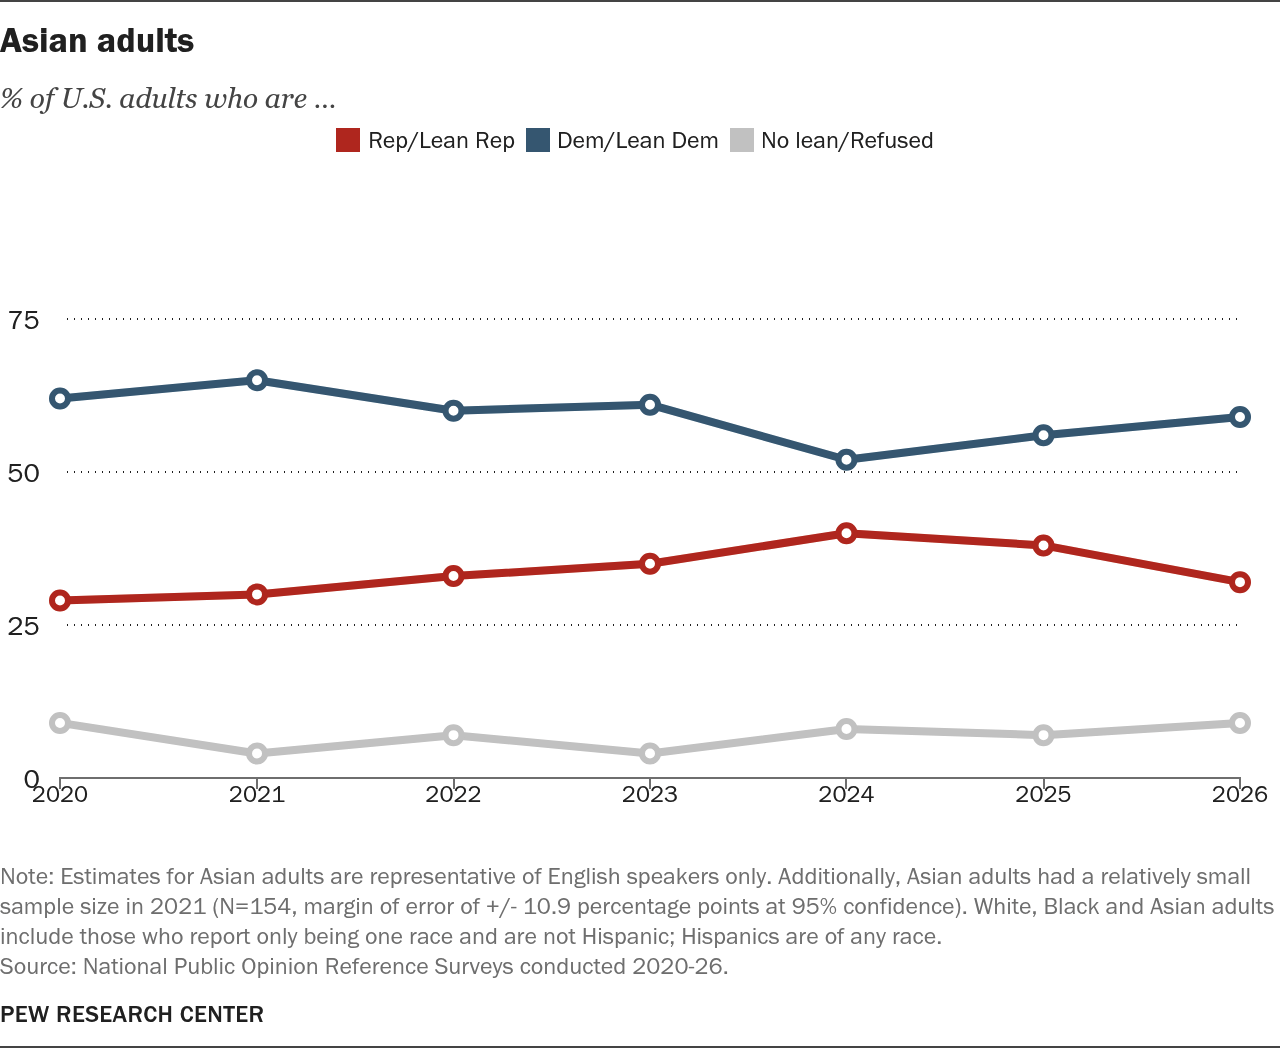
Democratic affiliation is higher than Republican affiliation among Black, Asian and Hispanic adults. And across these groups, there have been some modest shifts away from the Republican Party since 2025 – after it made some gains in previous years. White Americans continue to be more likely to affiliate with the Republican Party than the Democratic Party.
Asian adults
% of U.S. adults who are …
Note: Estimates for Asian adults are representative of English speakers only. Additionally, Asian adults had a relatively small sample size in 2021 (N=154, margin of error of +/- 10.9 percentage points at 95% confidence). White, Black and Asian adults include those who report only being one race and are not Hispanic; Hispanics are of any race.
Source: National Public Opinion Reference Surveys conducted 2020-26.
Note: Estimates for Asian adults are representative of English speakers only. Additionally, Asian adults had a relatively small sample size in 2021 (N=154, margin of error of +/- 10.9 percentage points at 95% confidence). White, Black and Asian adults include those who report only being one race and are not Hispanic; Hispanics are of any race.
Source: National Public Opinion Reference Surveys conducted 2020-26.
PEW RESEARCH CENTER
Black adults
% of U.S. adults who are …
Note: White, Black and Asian adults include those who report only being one race and are not Hispanic; Hispanics are of any race.
Source: National Public Opinion Reference Surveys conducted 2020-26.
Note: White, Black and Asian adults include those who report only being one race and are not Hispanic; Hispanics are of any race.
Source: National Public Opinion Reference Surveys conducted 2020-26.
PEW RESEARCH CENTER
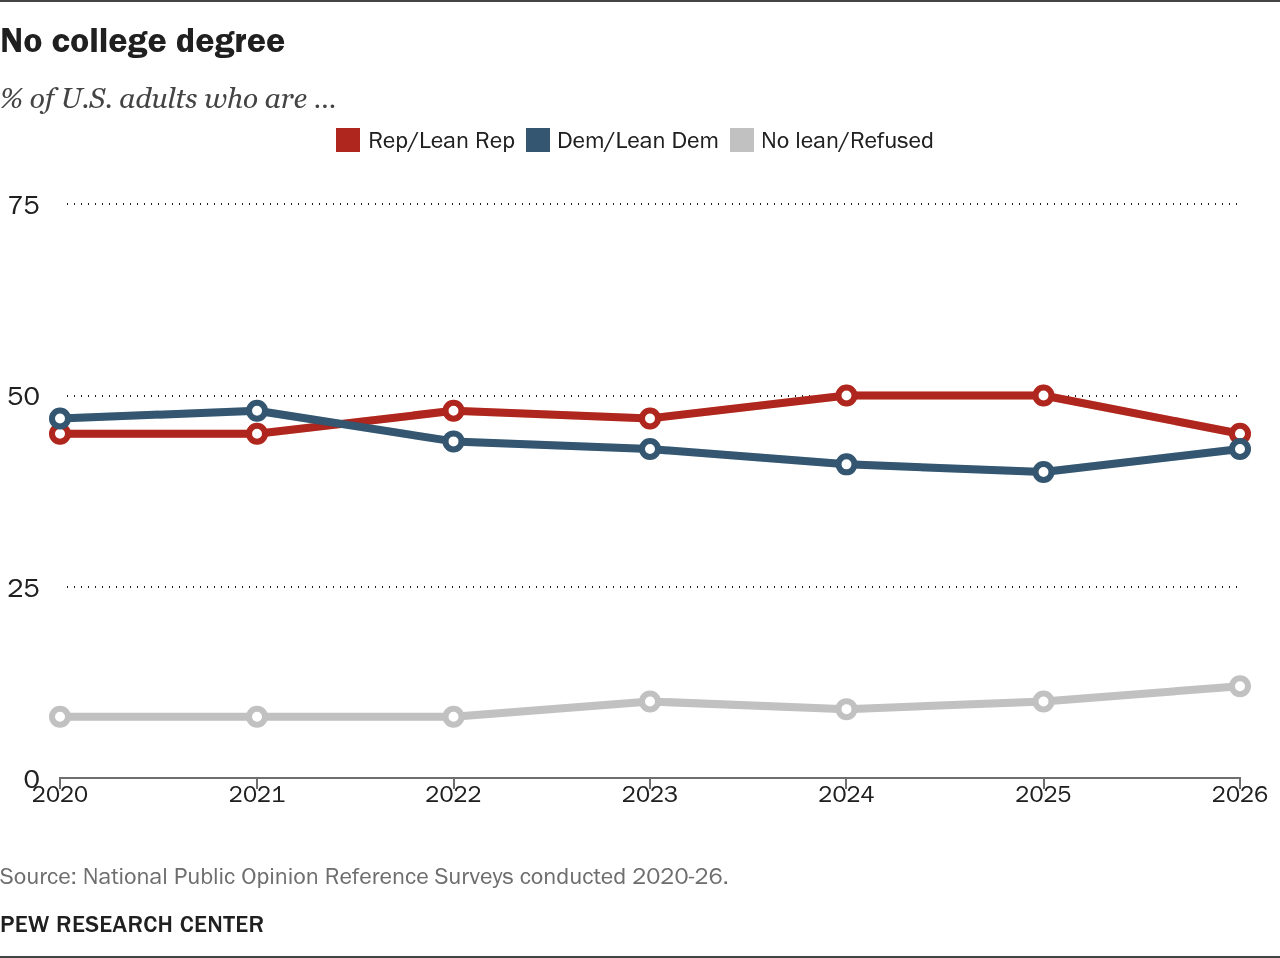
Partisanship by education
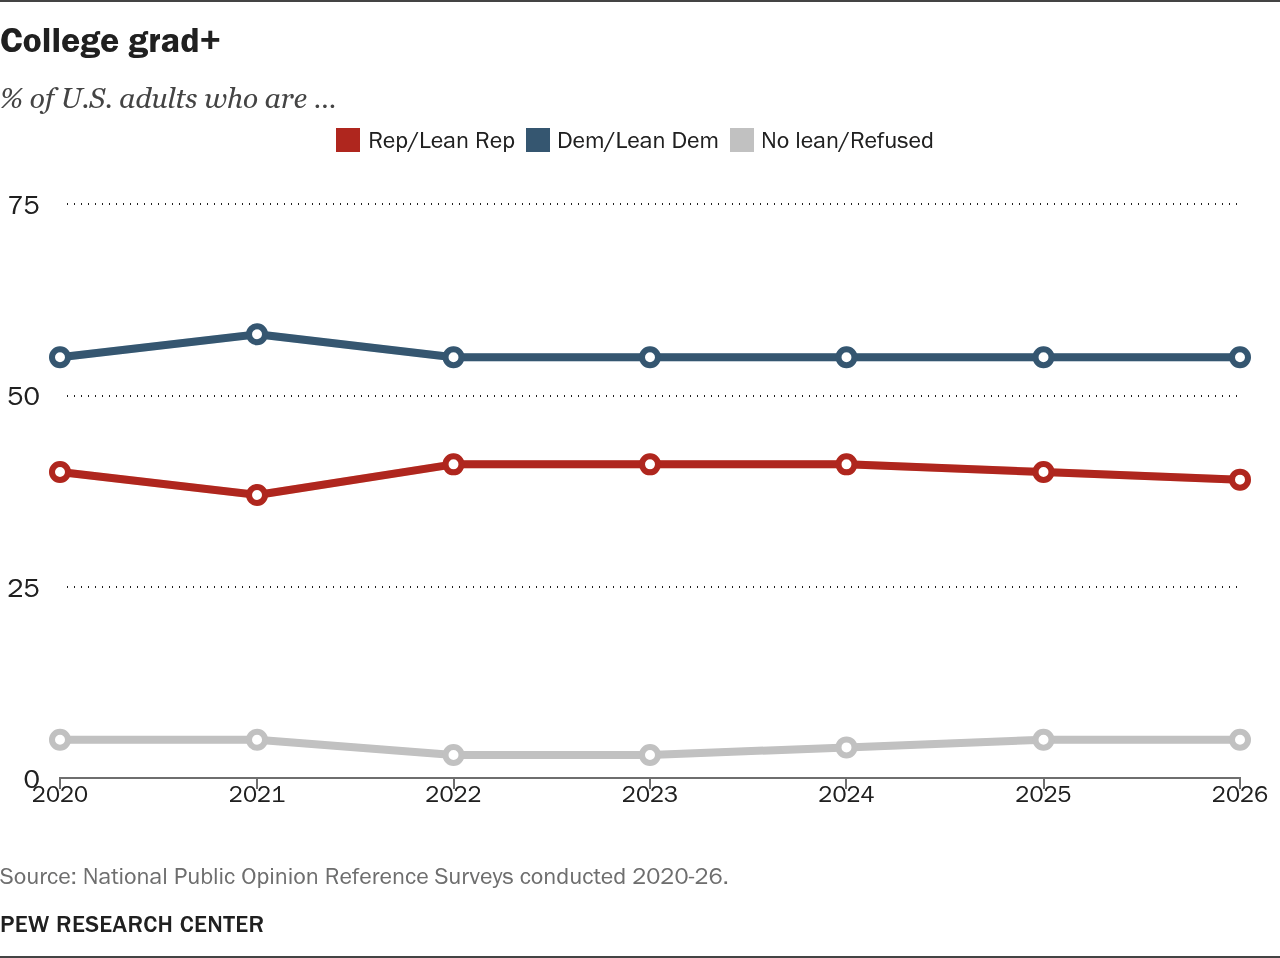
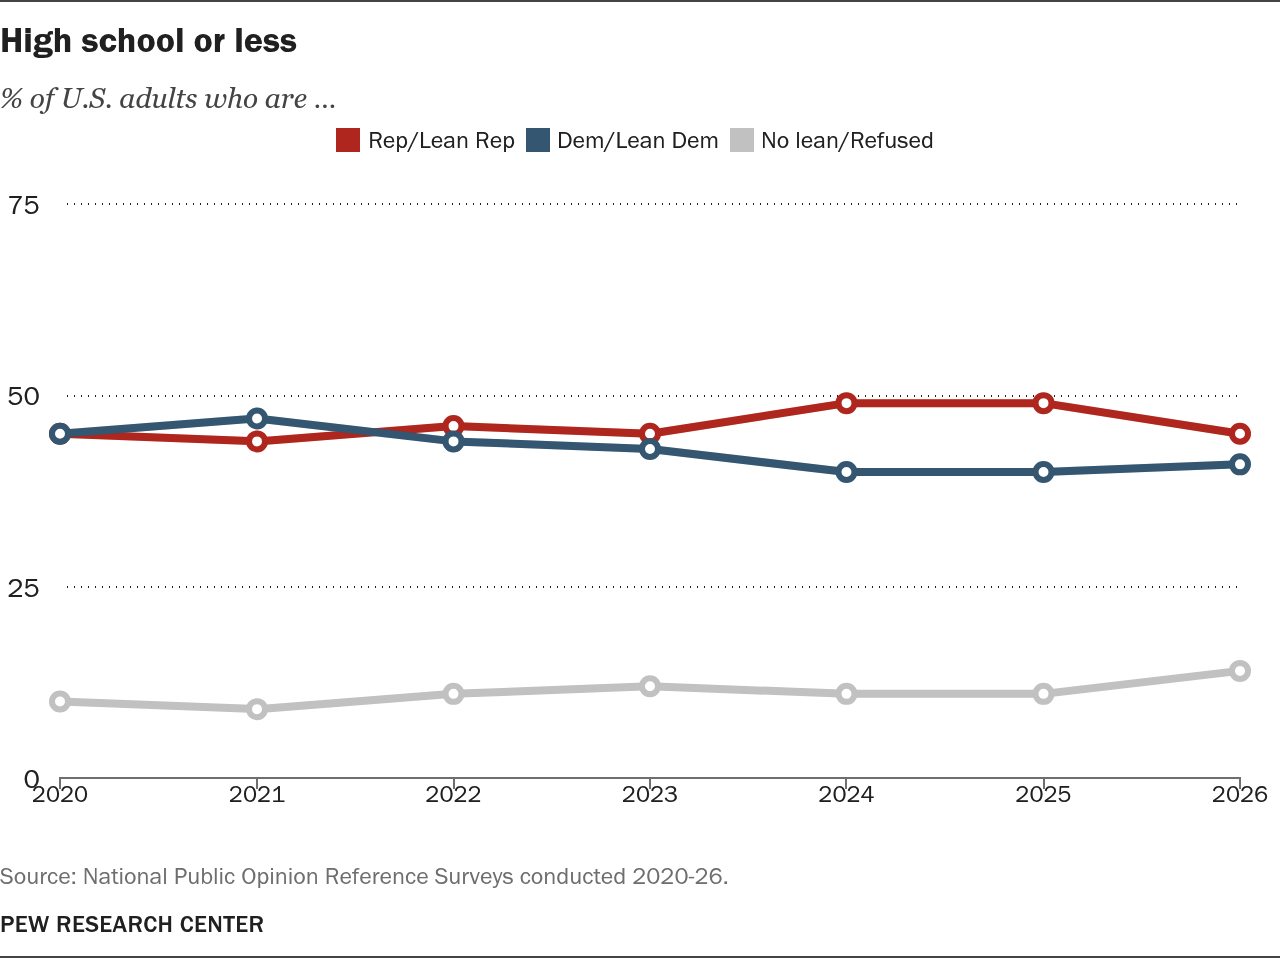
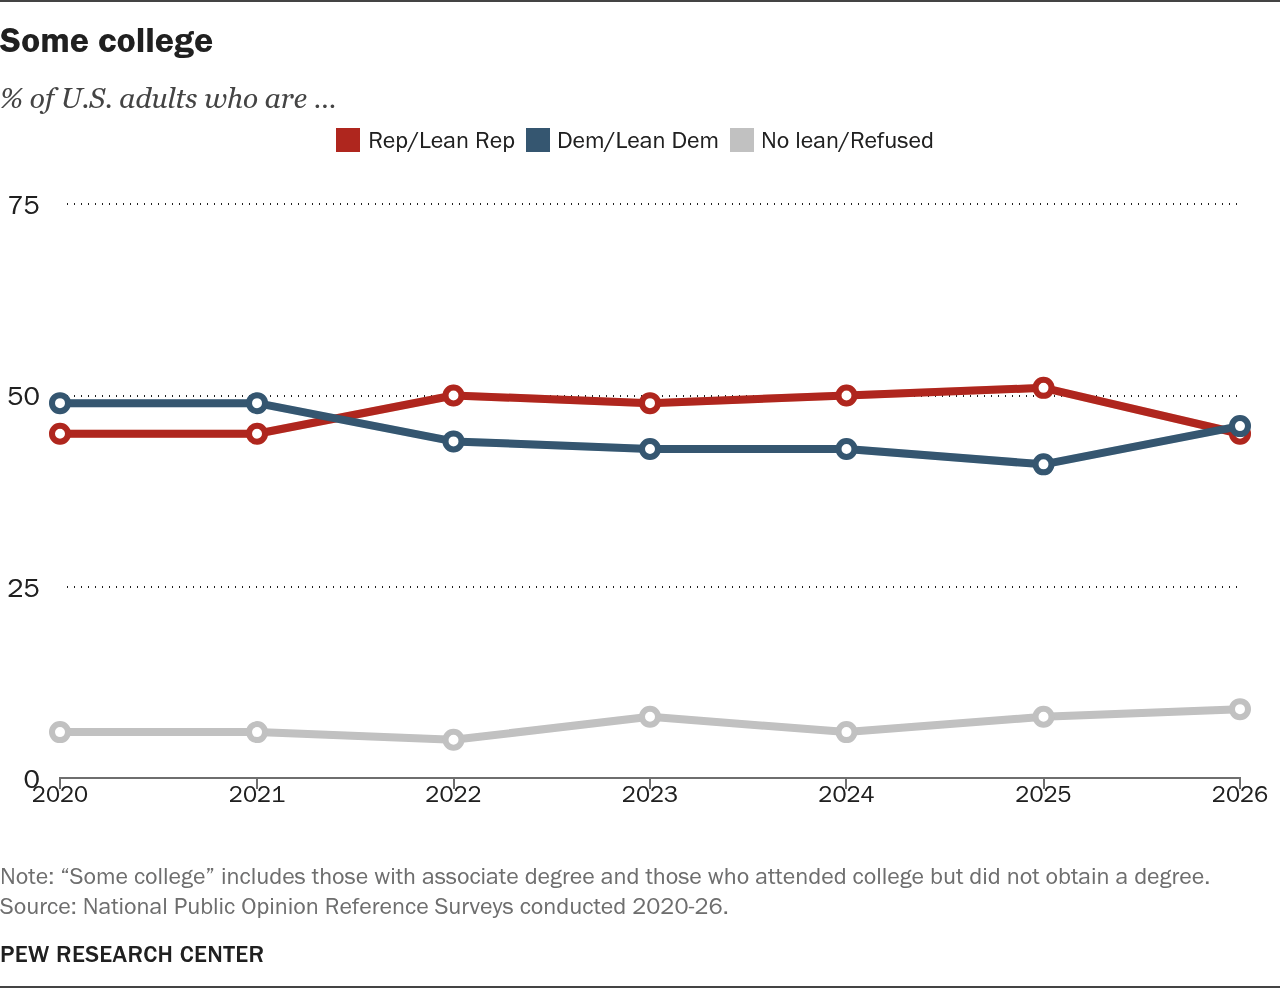
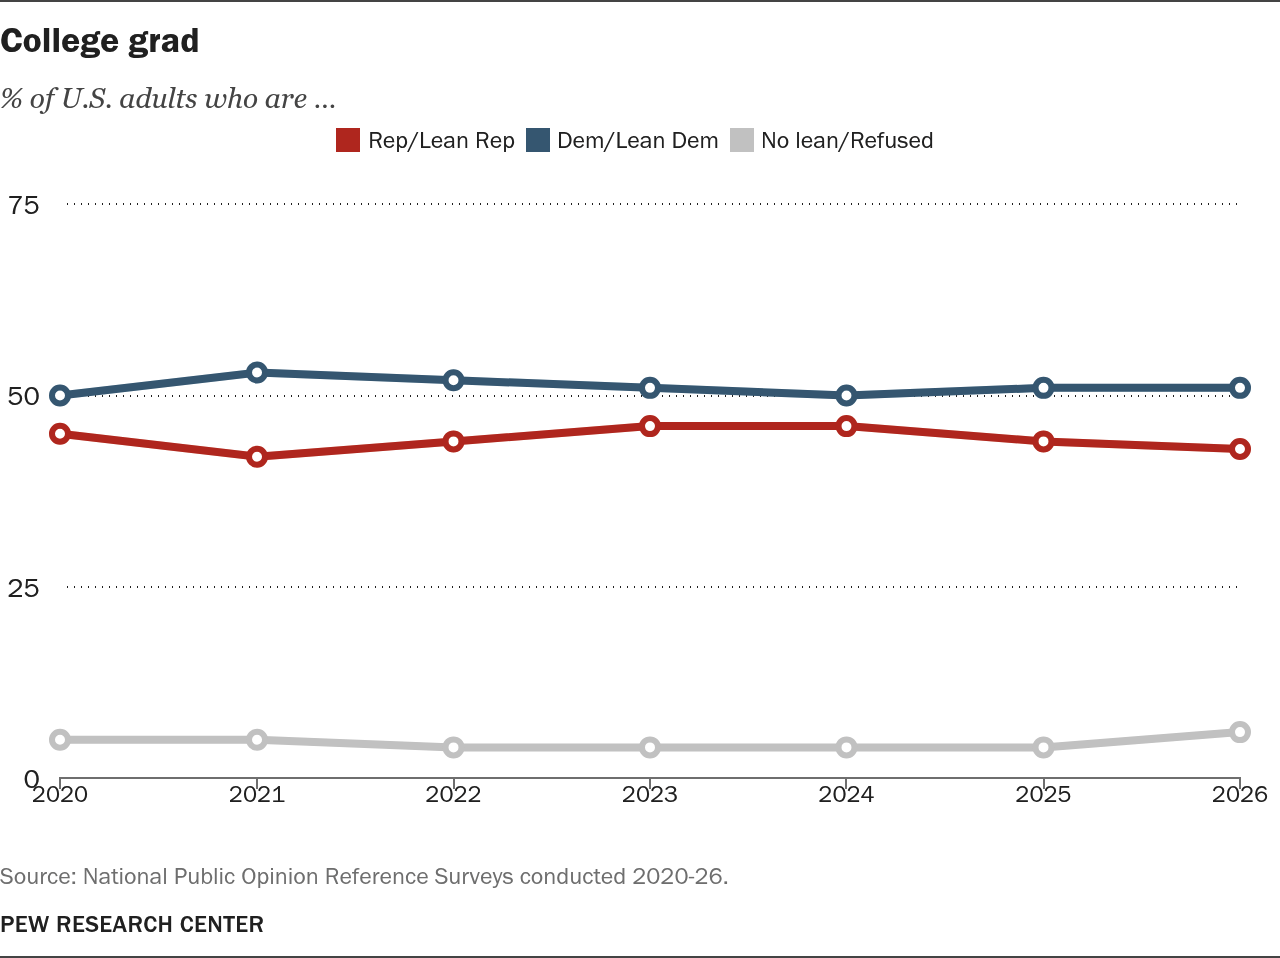
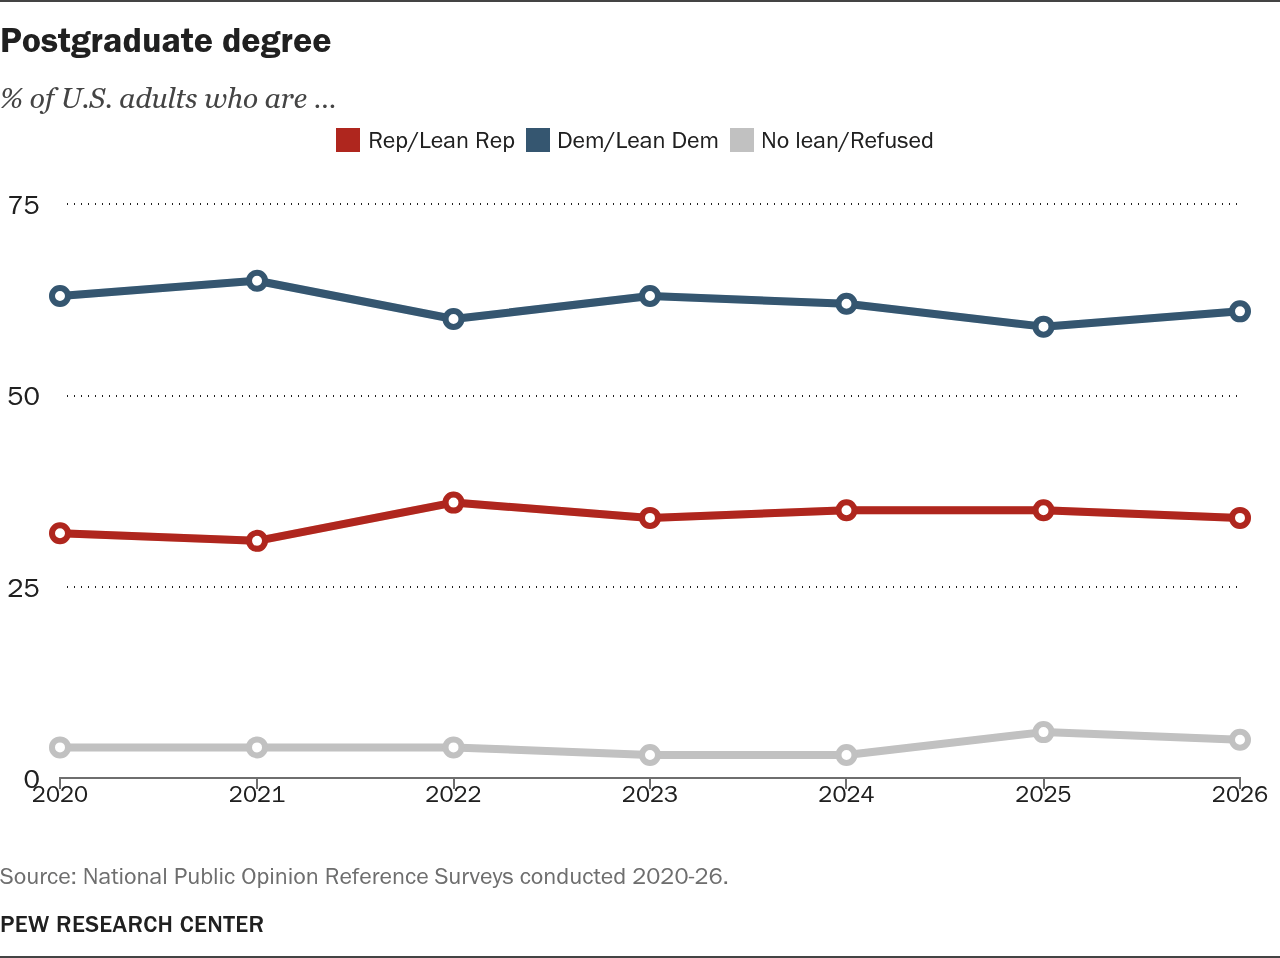
Education is strongly associated with partisanship, though this has not always been the case. Adults with a four-year college degree or more formal education tend to identify with or lean toward the Democratic Party, while adults without a college degree are now about equally divided between the two parties.
Two-way education:
No college degree
% of U.S. adults who are …
Source: National Public Opinion Reference Surveys conducted 2020-26.
Source: National Public Opinion Reference Surveys conducted 2020-26.
PEW RESEARCH CENTER
Some college
% of U.S. adults who are …
Note: “Some college” includes those with associate degree and those who attended college but did not obtain a degree. Source: National Public Opinion Reference Surveys conducted 2020-26.
Note: “Some college” includes those with associate degree and those who attended college but did not obtain a degree. Source: National Public Opinion Reference Surveys conducted 2020-26.
PEW RESEARCH CENTER
College grad
% of U.S. adults who are …
Source: National Public Opinion Reference Surveys conducted 2020-26.
Source: National Public Opinion Reference Surveys conducted 2020-26.
PEW RESEARCH CENTER
Partisanship by age group and generational cohort
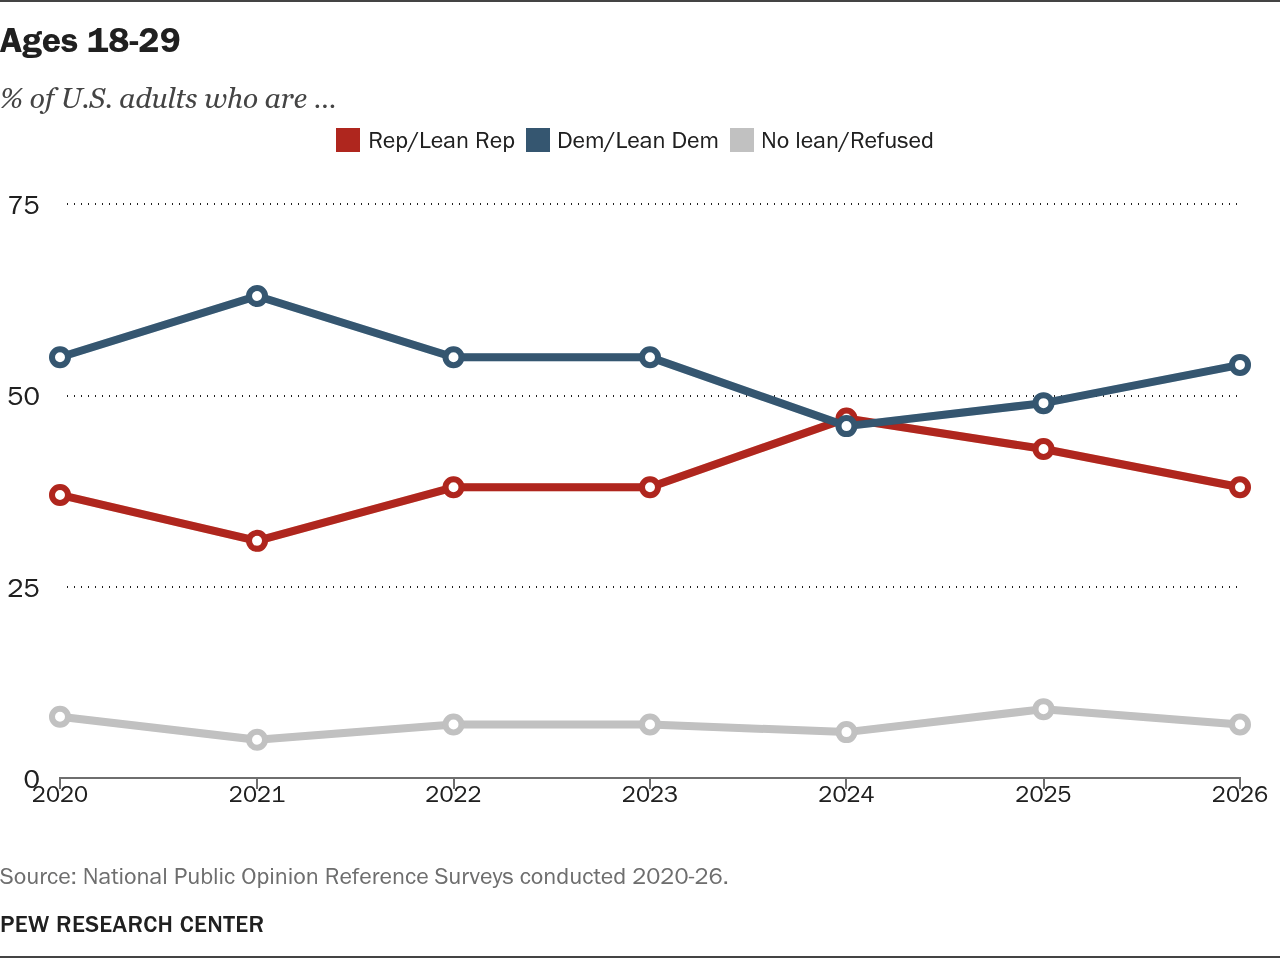
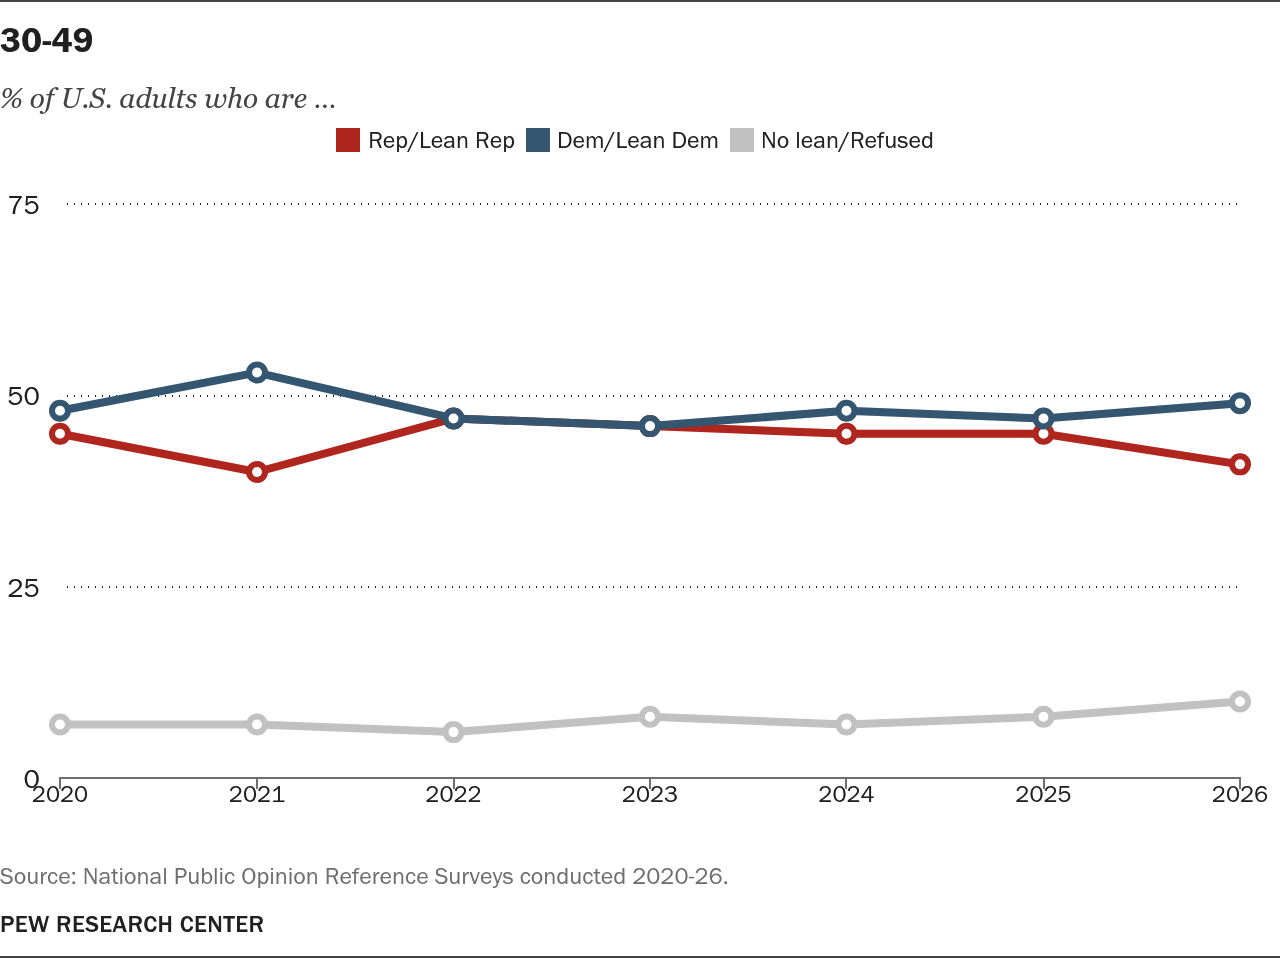
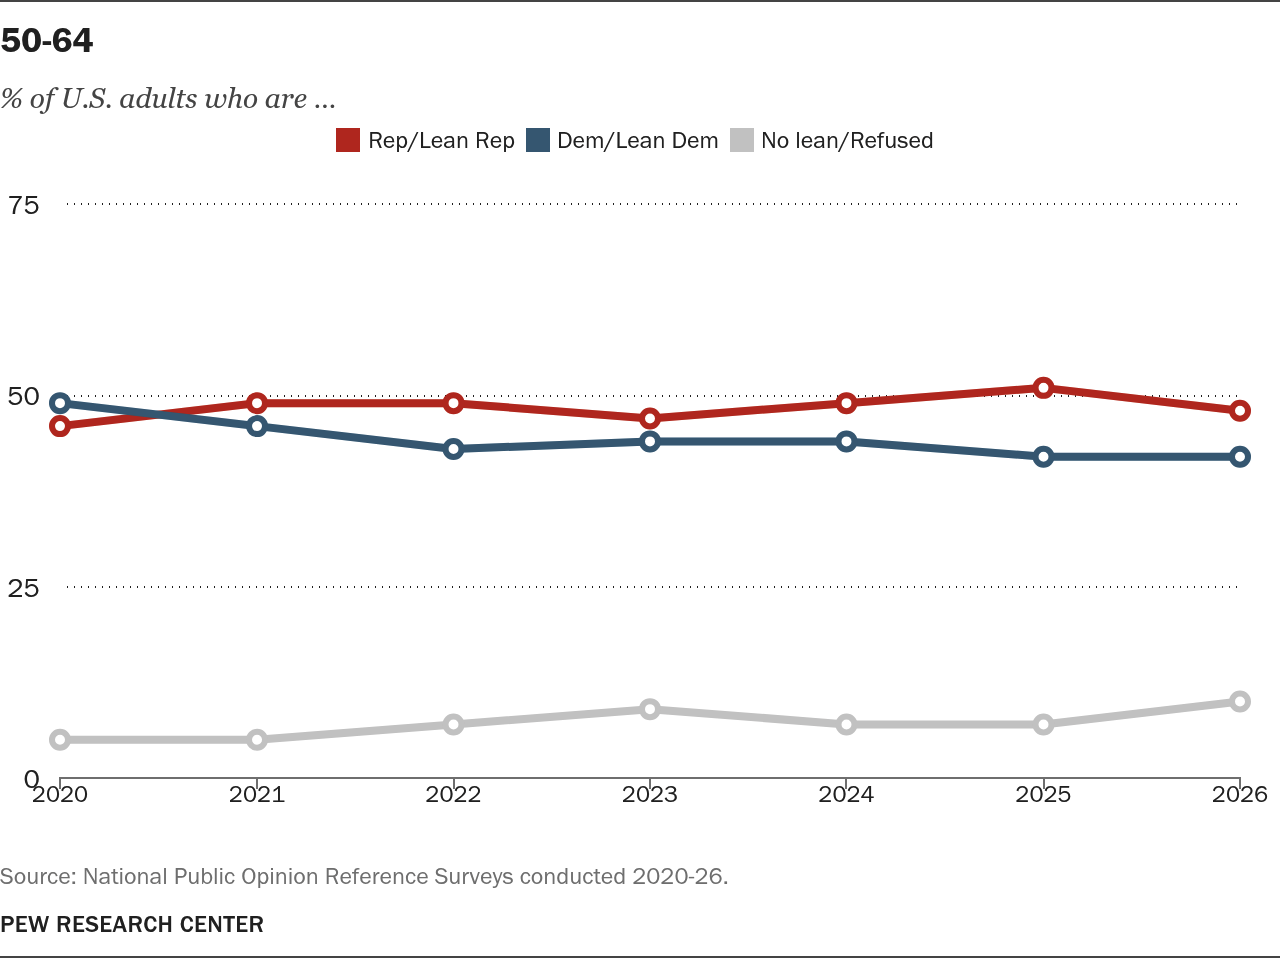
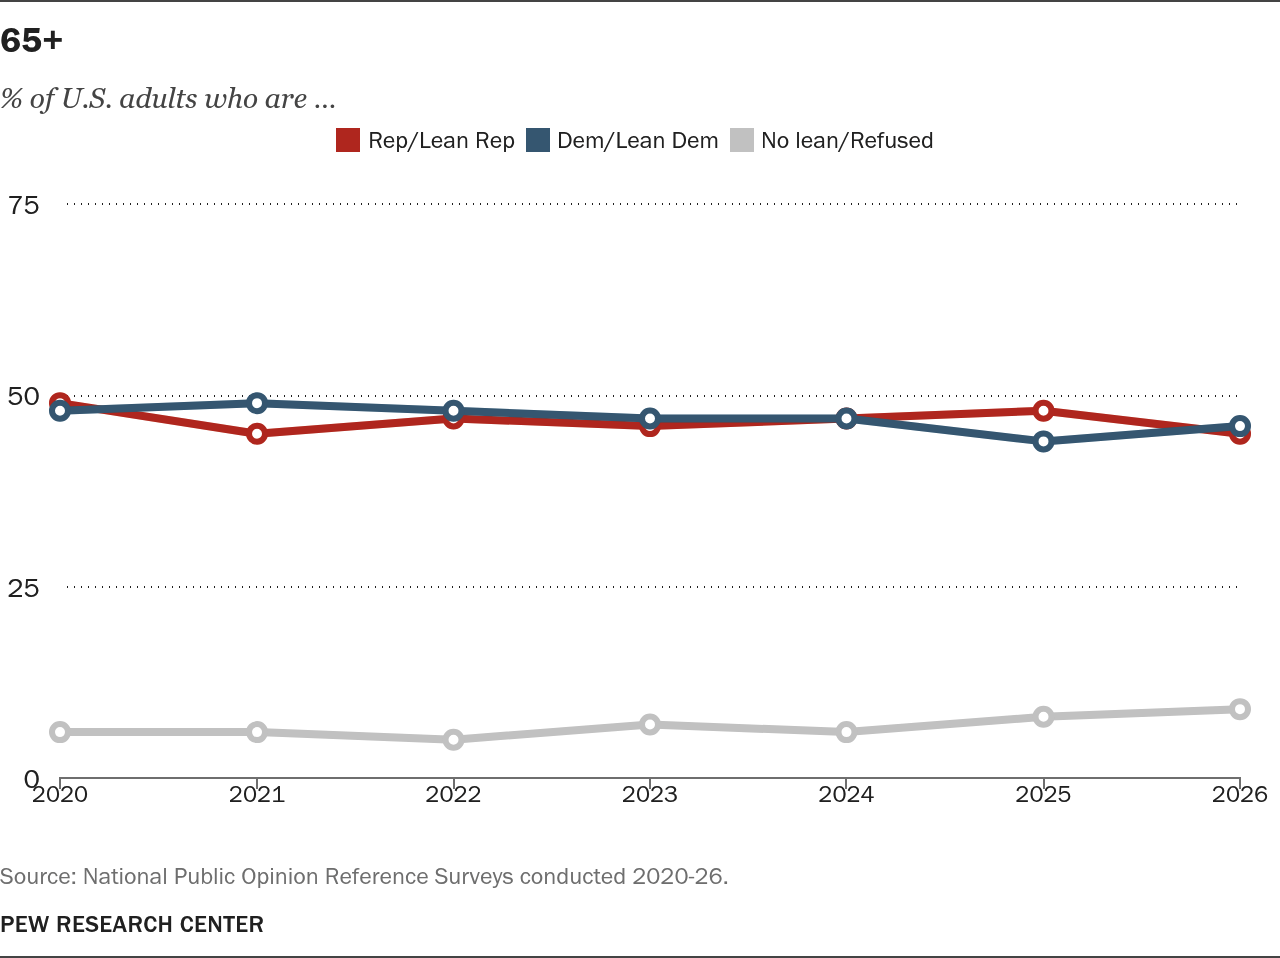
U.S. adults under 50 currently tilt Democratic, while those ages 50 to 64 tilt Republican and those 65 and older are more evenly divided. The balance of partisan identification among the youngest group of adults – those ages 18 to 29 today – is nearly identical to the balance among those who were ages 18 to 29 in 2022, ahead of the 2022 midterm elections.
By definition, the people in an age group are slowly replaced over time as people age into, and out of, age groups. Change within an age group may be the result of changing attitudes, changing composition of that group, or both.
Age groups:
Ages 18-29
% of U.S. adults who are …
Source: National Public Opinion Reference Surveys conducted 2020-26.
Source: National Public Opinion Reference Surveys conducted 2020-26.
PEW RESEARCH CENTER
Looking instead at “generational cohorts” allows us to track partisanship among the same set of people as they grow older.
The balance of partisanship among some cohorts (for instance, those born in the 1960s, currently ages 57 to 66) has remained relatively stable in recent years. But partisanship has shifted more within other groups. For example, the Democratic Party once again has a sizable edge among people born in the 1990s (currently ages 27 to 36) and those born in the 1980s (currently ages 37 to 46) – a shift from last year.
Generational cohorts:
Born in the 1940s (ages 77-86 in 2026)
% of U.S. adults who are …
Source: National Public Opinion Reference Surveys conducted 2020-26.
Source: National Public Opinion Reference Surveys conducted 2020-26.
PEW RESEARCH CENTER
Born in the 2000s (ages 18-26 in 2026)
% of U.S. adults who are …
Note: The “Born in the 2000s” cohort are still becoming adults (those under 18 are not included in these surveys). Data is shown for years in which at least 80% of the cohort are 18 or older. Source: National Public Opinion Reference Surveys conducted 2020-26.
Note: The “Born in the 2000s” cohort are still becoming adults (those under 18 are not included in these surveys). Data is shown for years in which at least 80% of the cohort are 18 or older. Source: National Public Opinion Reference Surveys conducted 2020-26.
PEW RESEARCH CENTER
Defining generational cohorts
This analysis uses generational cohort groups that are based on the decade in which respondents were born. Decades are defined as the years sharing the same tens-place digit. For example, the 1940s cohort was born between Jan. 1, 1940, and Dec. 31, 1949.
Data is shown for cohorts where at least 80% of their members in 2026 are 18 or older. Data is not shown for those born in the 1930s or earlier as there are too few people in these oldest cohorts to report on their views.
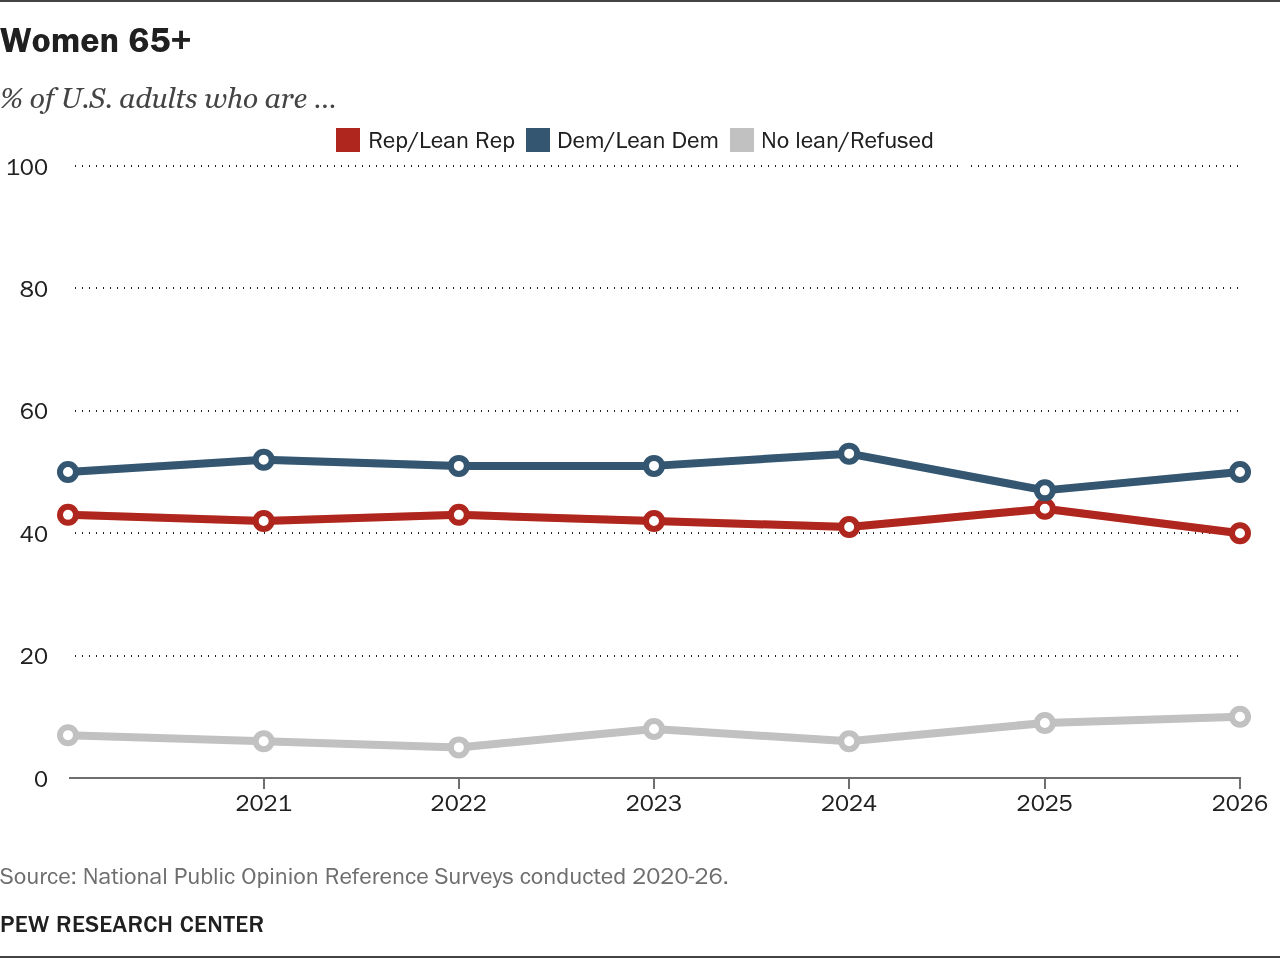
Partisanship by age and gender
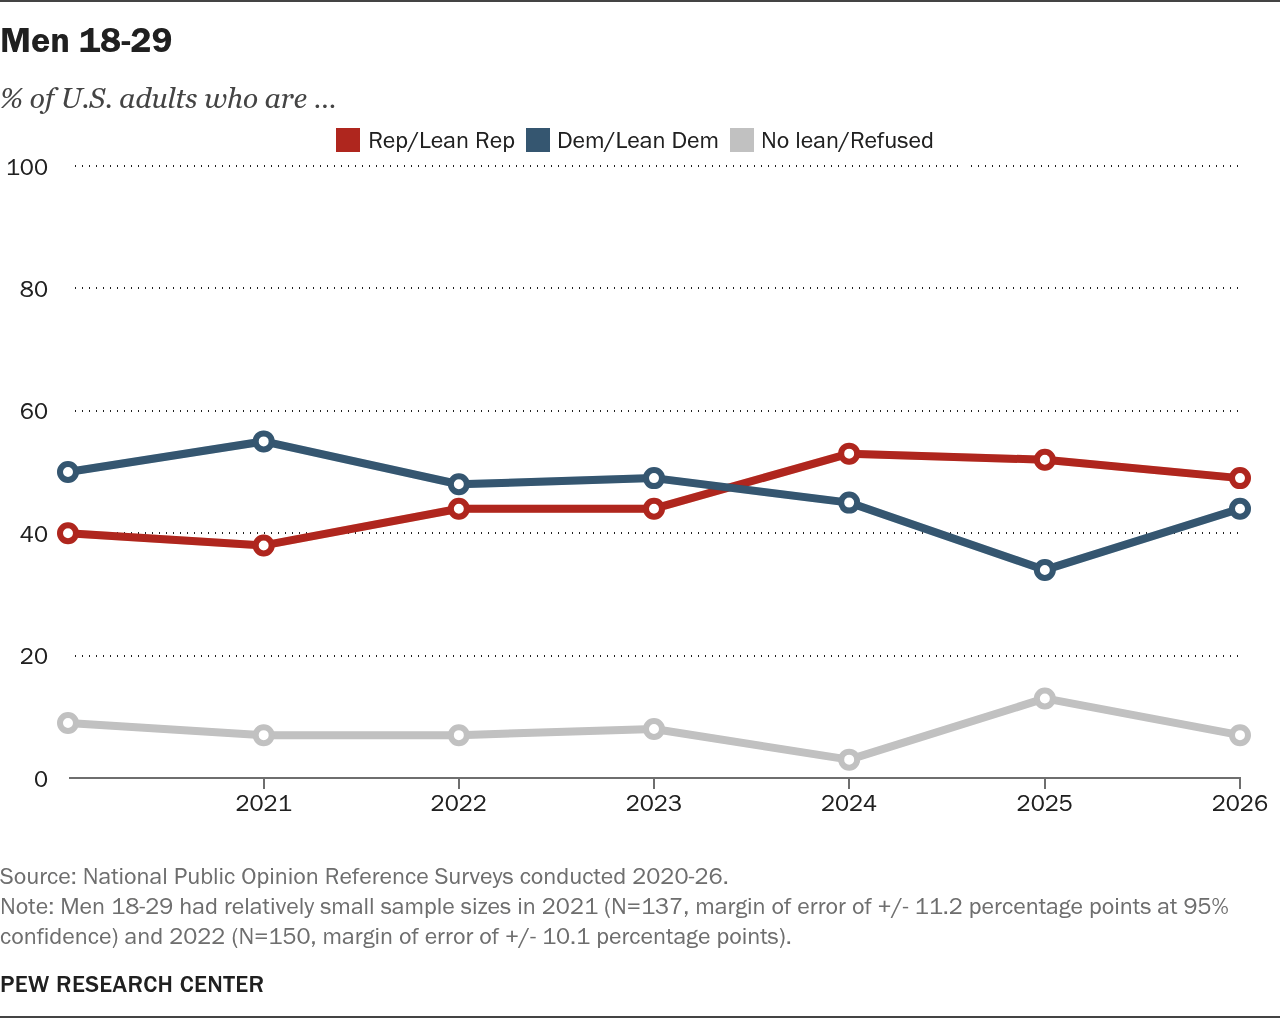
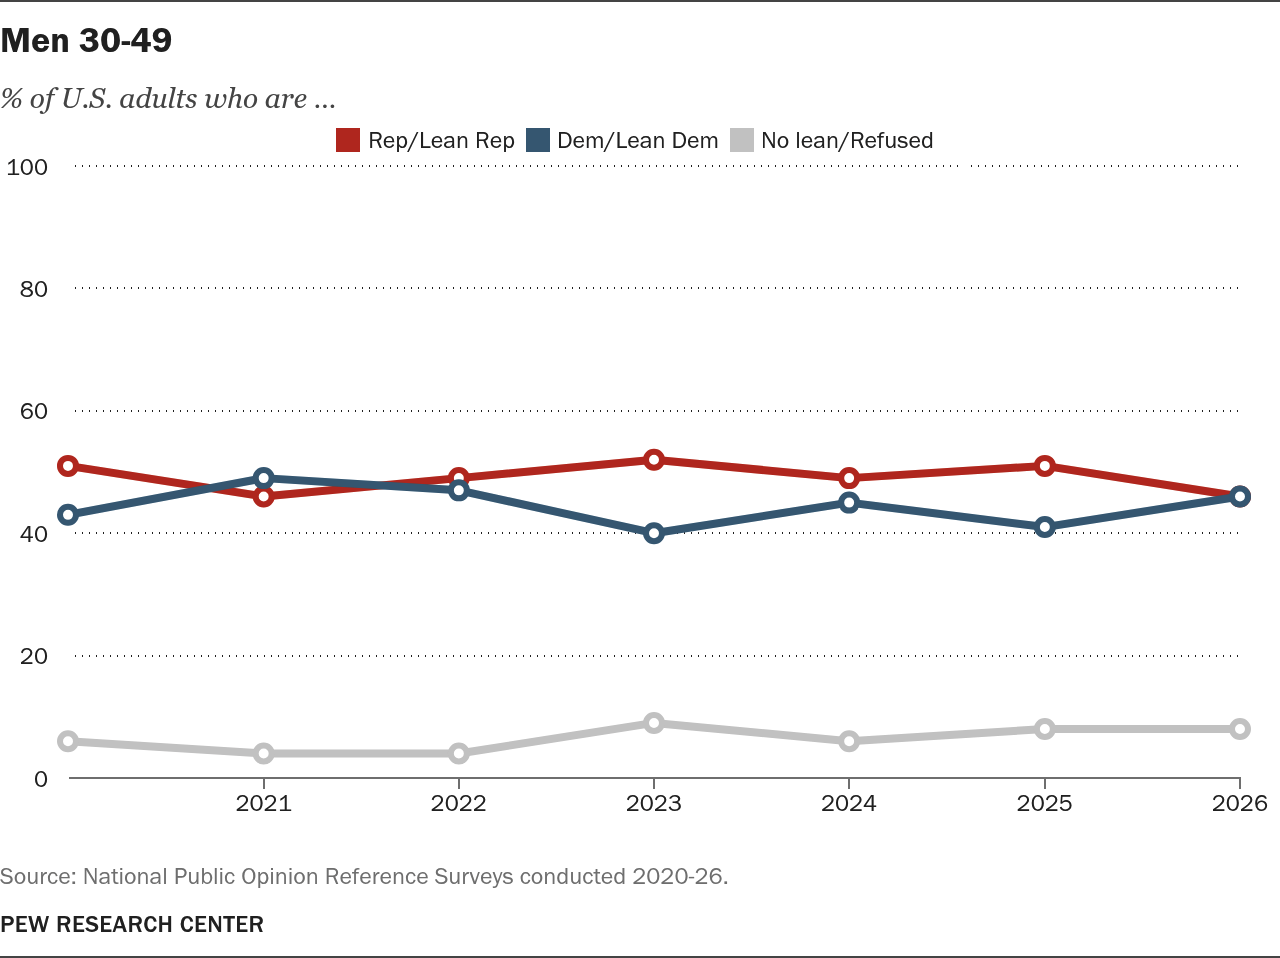
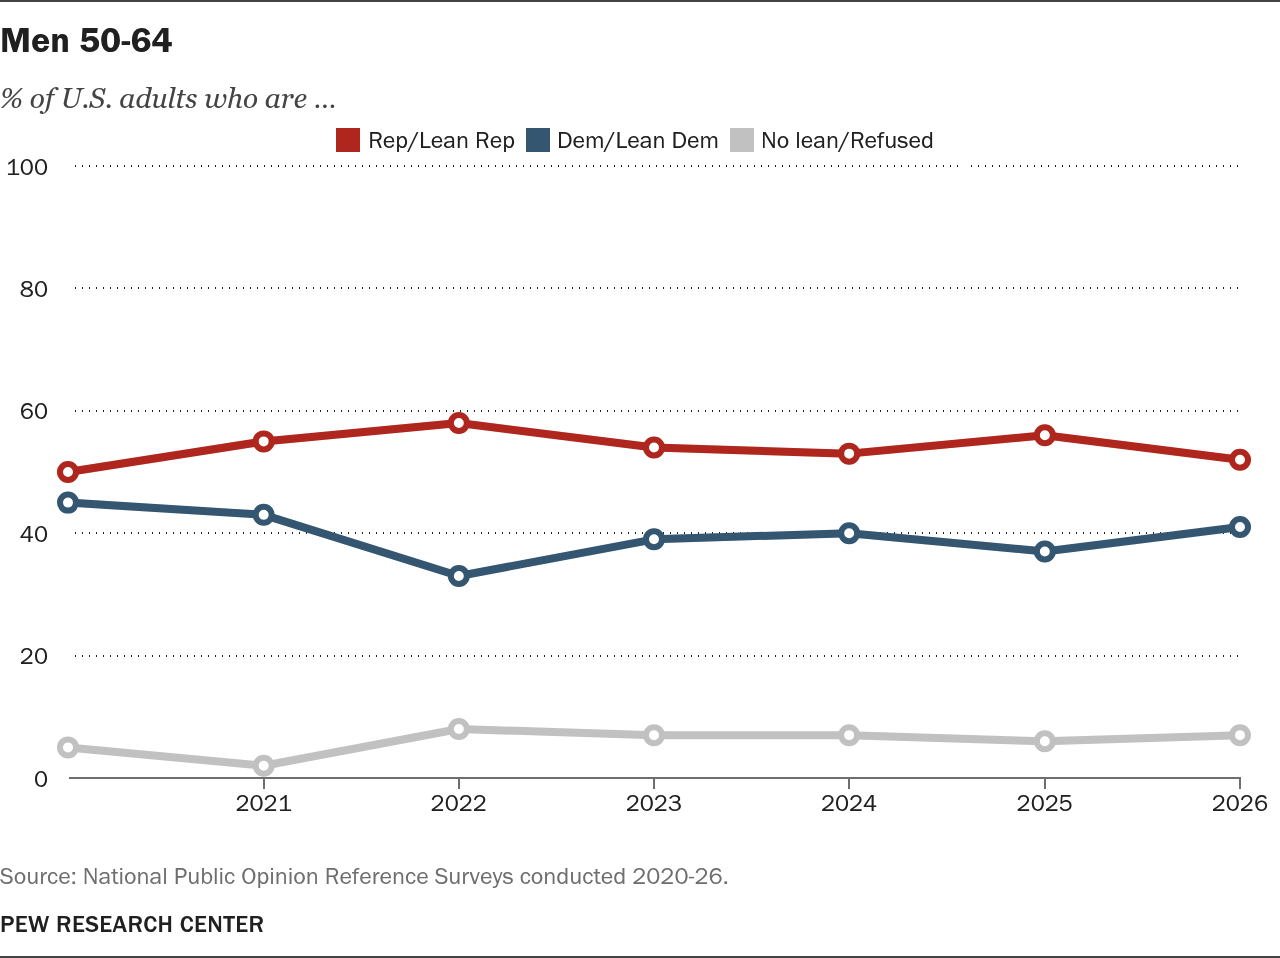
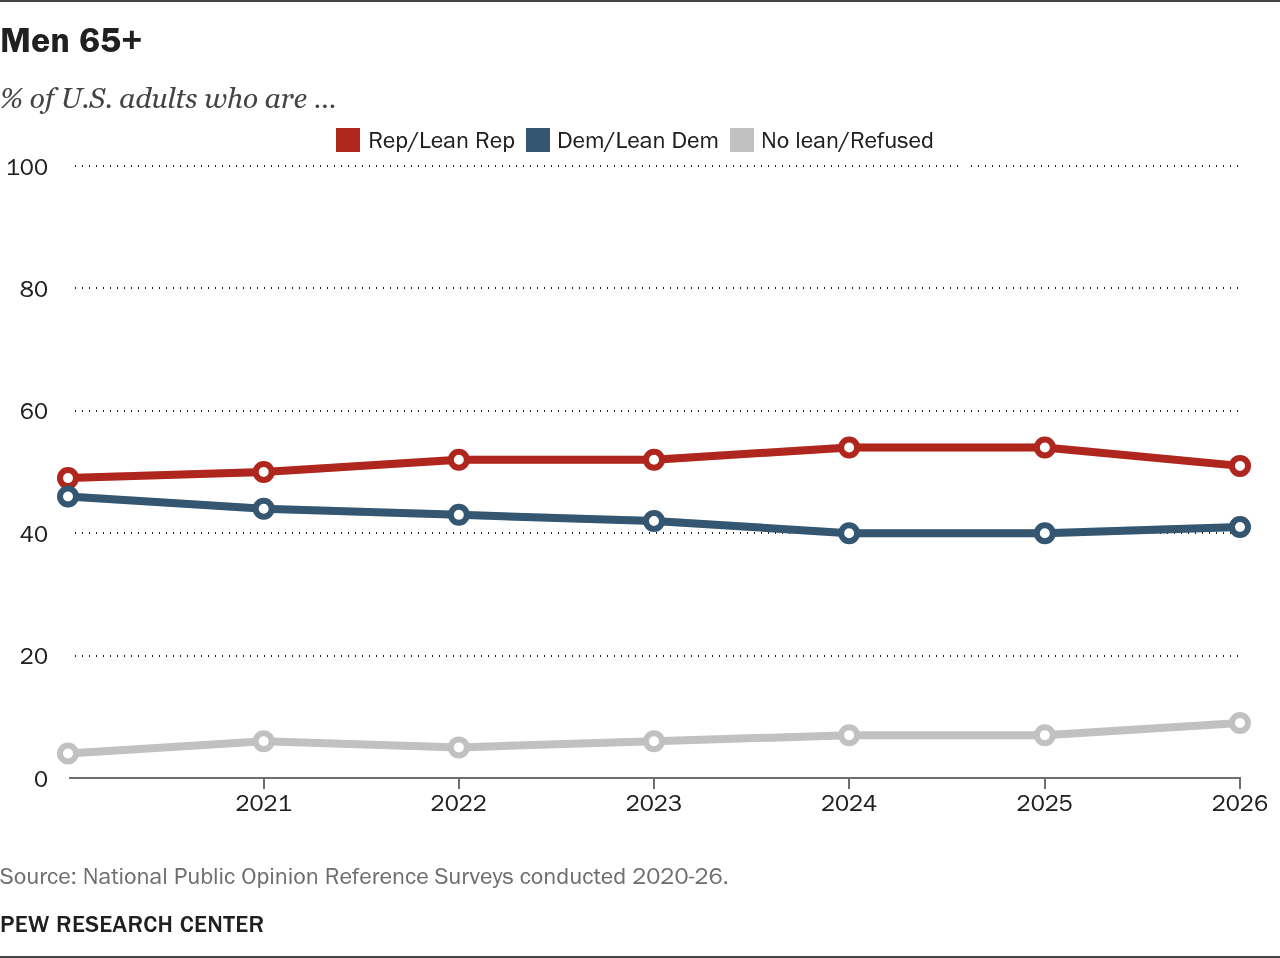
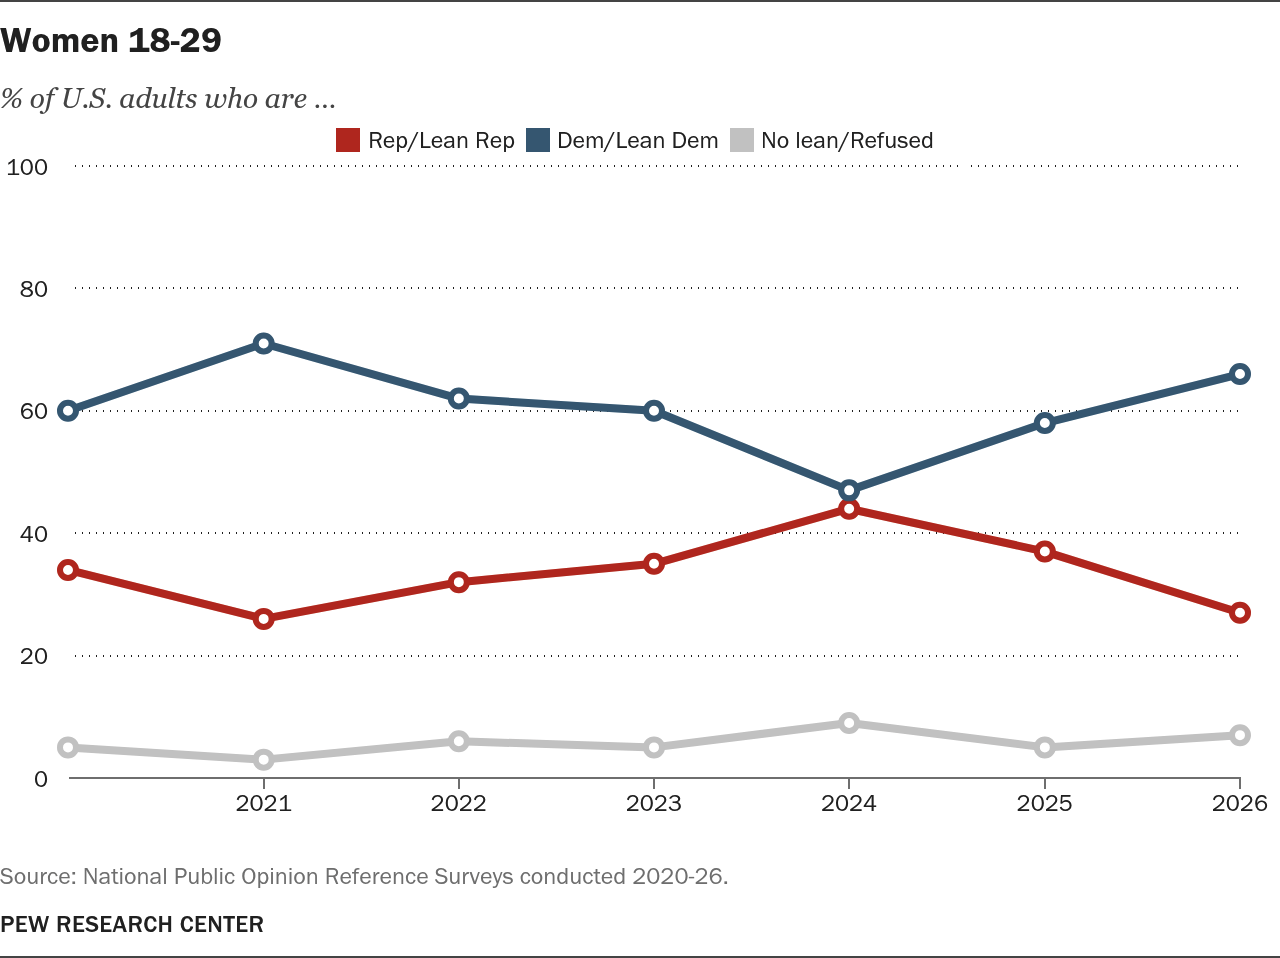
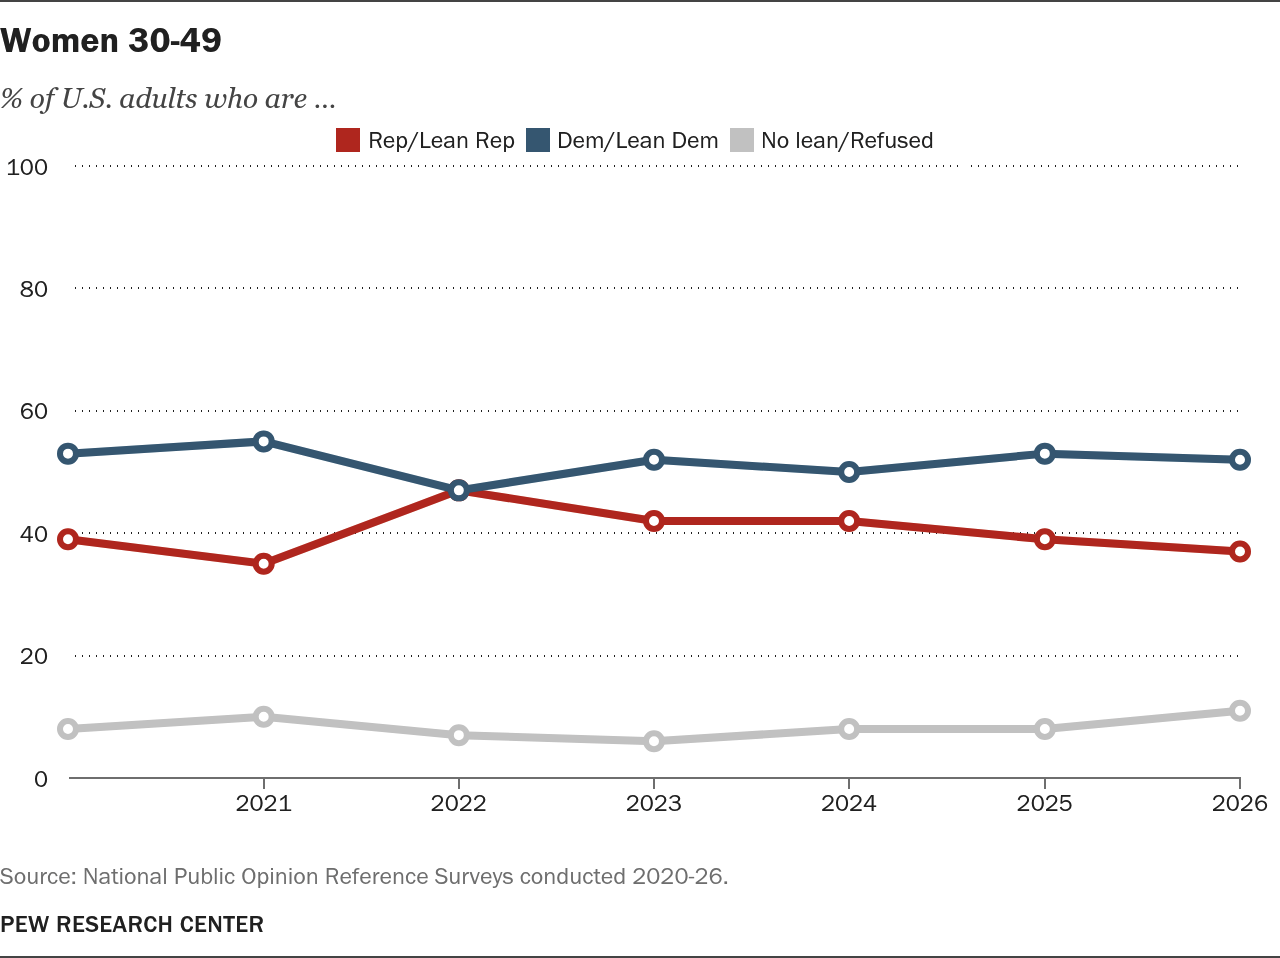
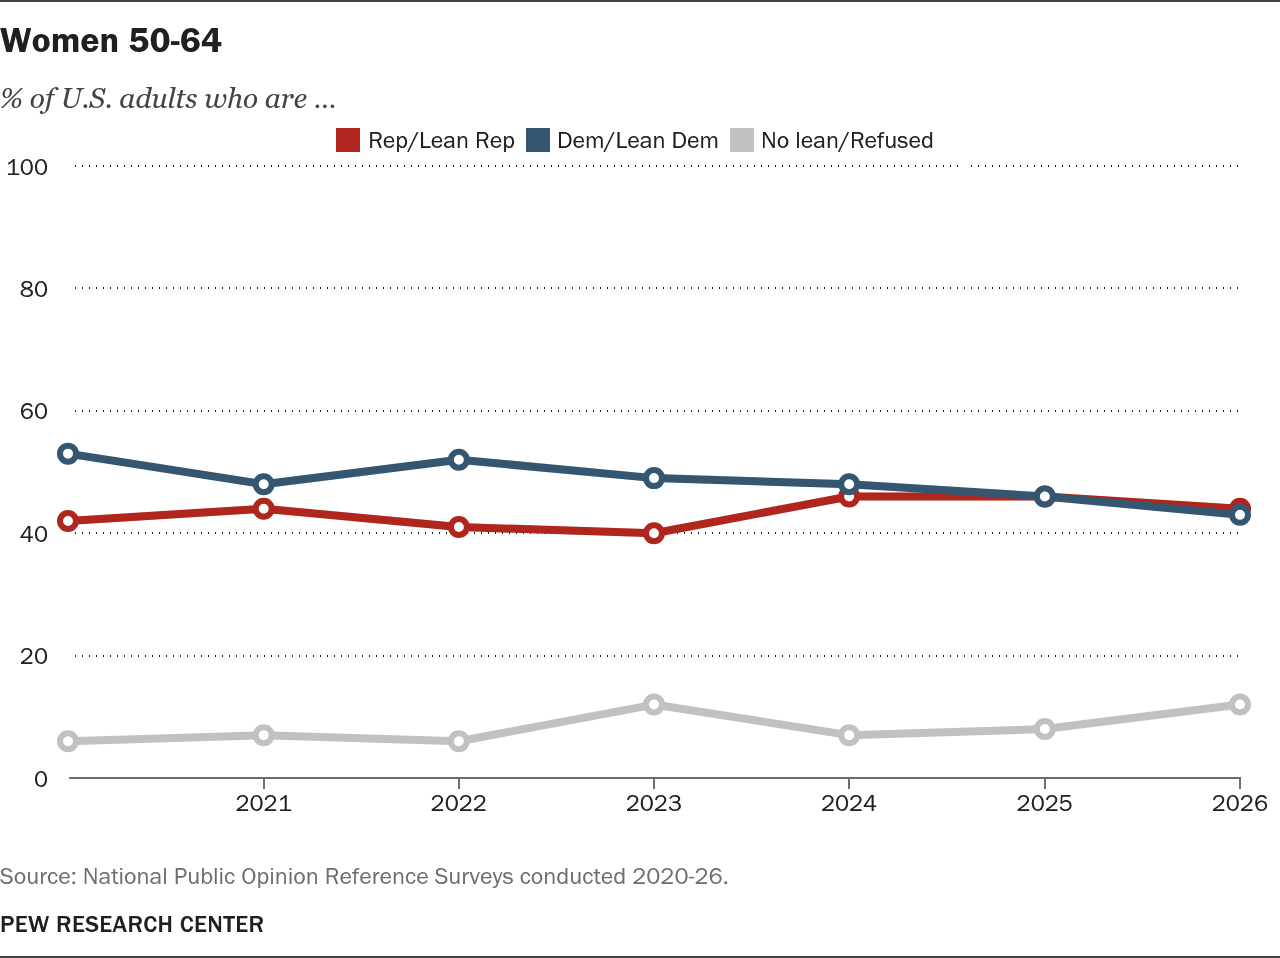
Men in all age groups are more likely to align with the Republican Party than the Democratic Party. And, consistent with the overall gender gap, women in all age groups are less Republican than men of the same age. While there are no significant age differences in partisanship among men, women under 50 are more likely to affiliate with the Democratic Party than women ages 50 and older.
The gender gap is largely similar across age groups, with the difference among adults ages 18 to 29 roughly in line with older age groups.
Note: Sample sizes for these subgroups are relatively small, and this is particularly the case for men and women under 30. As a result, there is greater uncertainty for this group than others. For instance, the shifts in men under 30 away from the Democratic Party between 2024 and 2025 – and then movement back toward the Democratic Party between 2025 and 2026 — are only modestly statistically significant, as the margin of error around the estimates of this group is fairly large. Refer to the margin of error table for more detail.
Men 18-29
% of U.S. adults who are …
Note: Men 18-29 had relatively small sample sizes in 2021 (N=137, margin of error of +/- 11.2 percentage points at 95% confidence) and 2022 (N=150, margin of error of +/- 10.1 percentage points). Source: National Public Opinion Reference Surveys conducted 2020-26.
Note: Men 18-29 had relatively small sample sizes in 2021 (N=137, margin of error of +/- 11.2 percentage points at 95% confidence) and 2022 (N=150, margin of error of +/- 10.1 percentage points). Source: National Public Opinion Reference Surveys conducted 2020-26.
PEW RESEARCH CENTER
Men 30-49
% of U.S. adults who are …
Source: National Public Opinion Reference Surveys conducted 2020-26.
Source: National Public Opinion Reference Surveys conducted 2020-26.
PEW RESEARCH CENTER
Additional resources
For detailed analysis of partisan identification among U.S. registered voters (including longer-term trends and additional subgroup analysis), read “Changing Partisan Coalitions in a Politically Divided Nation,” from April 9, 2024. Unlike this fact sheet, the 2024 report draws upon Pew Research Center’s American Trends Panel data from 2019 to 2023 and Center telephone survey data from 1994 to 2018, and it is based on registered voters instead of the general public.
This fact sheet was compiled by Senior Researcher Baxter Oliphant and Research Analyst Andy Cerda. Director of Political Research Jocelyn Kiley, Associate Director Steve Shepard, Research Analysts Shanay Gracia and Ted Van Green, Editorial Specialist Shifra Dayak, Associate Director Peter Bell and Digital Producer Reem Nadeem also provided assistance.
About this fact sheet
This analysis examines U.S. adults’ partisan identification across major demographic groups and across time using data from the latest National Public Opinion Reference Survey (NPORS), which surveyed 5,511 U.S. adults from Jan. 30 to June 18, 2026.
NPORS uses address-based sampling and a multimode protocol that includes web, mail and phone interviews. This way nearly all U.S. adults have a chance of selection. The survey is weighted to be representative of the U.S. adult population by gender, race and ethnicity, education, and other categories. The accompanying NPORS fact sheet provides additional detail about its methodology, including the questionnaires.
For more information on sample sizes of groups included in the analysis, click here.