Two types of weights were created for the analyses found in this report.
Weights for analyses using ATP self-reported data
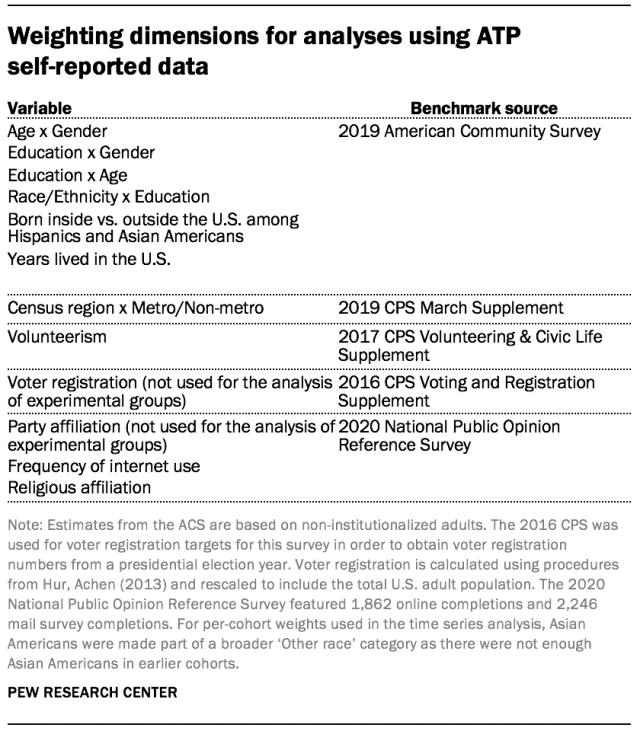
The first type of weight was designed to ensure each group (e.g., cohort) was individually representative of the general population. To accomplish this, the ATP data are weighted in a multistep process that accounts for multiple stages of sampling and nonresponse that occur at different points in the survey process. First, each panelist begins with a base weight that reflects their probability of selection for their initial recruitment survey (and the probability of being invited to participate in the panel in cases where only a subsample of respondents were invited). The base weights for panelists recruited in different years are scaled to be proportionate to the effective sample size for all active panelists in their cohort. To correct for nonresponse to the initial recruitment surveys and gradual panel attrition, the base weights for all active panelists are calibrated to align with population benchmarks identified in the accompanying table to create a full-panel weight.
For ATP surveys in which only a subsample of panelists are invited to participate, a survey-specific base weight is created by adjusting the full-panel weights for subsampled panelists to account for any differential probabilities of selection for the particular panel survey. For surveys in which all active panelists are invited to participate, the survey-specific base weight is identical to the full-panel weight.
In the final weighting step, the survey-specific base weights for panelists who completed the survey are again calibrated to match the population benchmarks specified above. For analyses that rely on individual panelists’ survey responses over multiple surveys, weights are created for the unique set of respondents who participated in all specified surveys.
These weights are trimmed (typically at about the 1st and 99th percentiles) to reduce the loss in precision stemming from variance in the weights. Sampling errors and test of statistical significance take into account the effect of weighting.
For the analysis in which respondents to the November 2019 survey were divided into two random groups and then were invited to participate in a survey in August 2020 along with a newly recruited cohort, each of the three experimental groups was weighted separately to the above population benchmarks. Panelists without internet access who were provided with a tablet were excluded from the analysis altogether, as they were not eligible for selection into the group that was not asked any questions about news and media for 11 months. Since party affiliation and voter registration from the August 2020 survey were used in the analysis, these variables were not incorporated into the weighting.
For the analysis conducted at multiple time points by recruitment cohort, only panelists who responded to the August 2020 survey, the most recent survey examined in the analysis, were included. Furthermore, in order to ensure that the set of panelists being analyzed consists of those who would have been eligible to join the panel during the first recruitment back in 2014, only panelists age 24 or older were included. Each cohort was weighted separately to population benchmarks estimated using the full panel weight among the subset of panelists eligible for this analysis. Party affiliation and voter registration measured in the August 2020 survey were weighted to the benchmarks listed above. As such, the analysis does not include August 2020 as a time point for party or registration.
Weights for analyses of commercial voter file data
A second type of weight was created for the analyses of the administrative data. These weights were not designed to create estimates representative of the general population. They were designed to maximized comparability across cohorts in 2012.
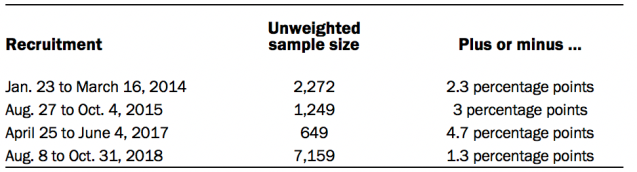
For the analysis of administrative data using commercial voter files, panelists were matched to a commercial voter file by a vendor. Only panelists that were members of the first four ATP recruitment surveys were included. This group consists of the Jan. 23 to March 16, 2014, Aug. 27 to Oct. 4, 2015, and April 25 to June 4, 2017, recruitments that were conducted via RDD and the Aug. 8 to Oct. 31, 2018, recruitment that was conducted via ABS. Within this group, only panelists that completed surveys via the internet, were US citizens and registered voters and were age 24 or older at the time of analysis were included.
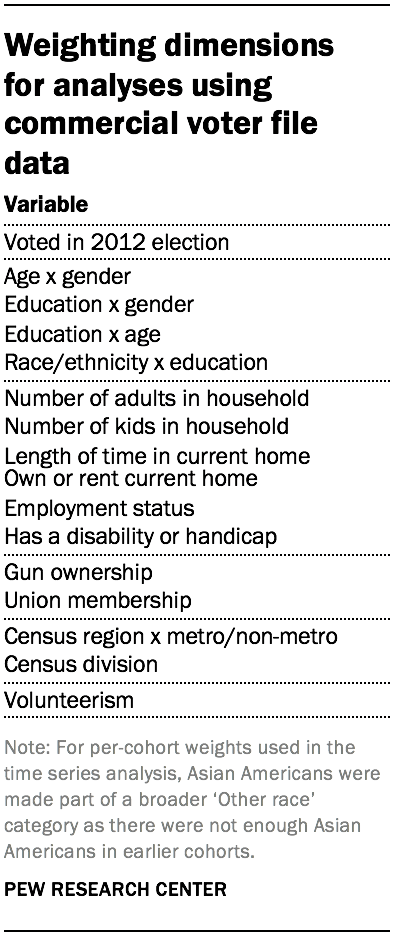
Weights for this analysis were not calibrated to population benchmarks to be representative of the U.S. at large but instead were calibrated so that each recruitment group resembled one another. First, each panelist begins with a base weight that reflects their probability of selection for their initial recruitment survey (and the probability of being invited to participate in the panel in cases where only a subsample of respondents were invited). The base weights for panelists recruited in different years are scaled to be proportionate to the effective sample size for all active panelists in their cohort. The three RDD recruitments were grouped and averaged together respective to each recruitment’s base weights (the first stage of weighting reflects each panelists probability of selection) to create weighting dimensions for voting in the 2012 election and a number of demographic, household, and attitudinal measures. Then, each cohort was weighted separately to these dimensions. For this analysis, weights were not trimmed to ensure that different recruitments were represented equally along these dimensions.