

Note: This report was updated on Dec. 30, 2015 to reflect the January-July 2015 National Health Interview Survey estimates released on December 1, 2015.
Telephone surveys face numerous challenges, but some positive developments have emerged, principally with respect to sampling. Companies that provide telephone samples have developed several products that have the potential to improve the efficiency of surveys in both the landline and cellphone frames and allow for more accurate geographic and demographic targeting of calling in the cellphone frame. A number of tests have been conducted with these products, and the relative costs and benefits of each are becoming clearer. This report describes some of these innovations and presents the results of experiments conducted with each of them.
Cellphones are a mainstay of contemporary telephone polls
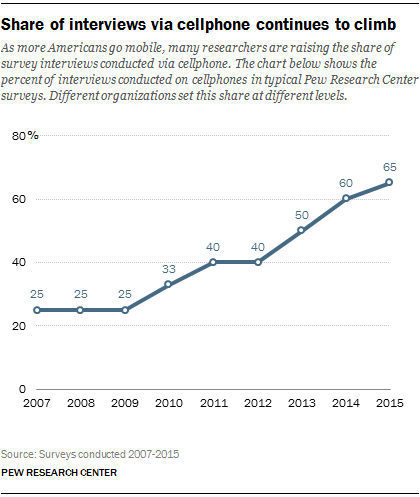
The most important change in telephone surveys in the past decade has been the adoption of dual frame survey designs that include cellphone numbers. Many survey organizations now conduct at least as many interviews by cellphone as by landline in national surveys. As of 2015, the typical Pew Research Center poll interviews 65% of its respondents on cellphones and 35% on landlines. The cellphone share has grown over time as the share of the population using only a cellphone has risen.1
Cellphone samples reach a more diverse sample of the public than do landlines. But this benefit is partially offset by the fact that less is known in advance about cellphone samples – in particular, where people actually live. Moreover, cellphone surveys are especially costly because of the government requirement that numbers be dialed manually. Therefore, any improvement in the accuracy and efficiency with which these samples reach the targeted respondents could yield significant benefits in terms of per-survey cost. Fortunately, new products are helping researchers make more effective use of cellphone samples.
Improving efficiency with activity flags
One factor contributing to the cost of cellphone interviewing is the substantial share of the numbers sampled and dialed by interviewers that turn out to be non-working, resulting in wasted interviewer time. As of 2015, the average incidence of non-working numbers in the U.S. cellphone random digit dial (RDD) frame was 38%. To reduce this inefficiency, RDD sample vendors have developed services to identify and discard cellphone numbers that are likely to be non-working before they are dialed.
These services make use of “activity flags,” which indicate whether a sampled cellphone number is currently active (and is likely working) based on either recent calling activity or a real-time test of the number’s working status. The flag is typically available for 95% or more of cellphone numbers. In 2012, vendors started making these flags available so that survey designers could remove pre-identified non-working numbers from their samples and, in turn, save money by reducing the amount of time interviewers spend dialing unproductive numbers. One team of researchers2 estimated that excluding flagged-inactive numbers can reduce the amount of labor hours needed for telephone interviewing by as much as 20%.
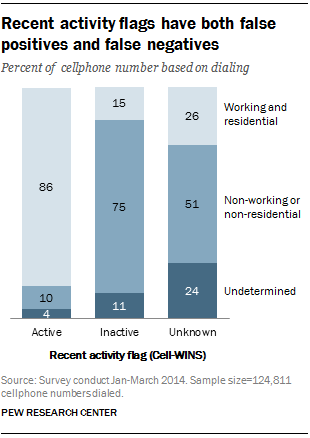
Unfortunately, the flags are not perfect, containing both false positives (numbers that are flagged-active but are actually non-working) and false negatives (numbers that are flagged-inactive but actually working). False positives are basically harmless, aside from the loss in efficiency. False negatives, however, have the potential to reduce the survey coverage rate and increase the risk of noncoverage error.
Pew Research Center, in collaboration with Abt SRBI, appended two different activity flags (Cell-WINS and Targus) in a large (n=10,013) national dual frame RDD survey in 2014. Half of the interviews in that study were conducted on cellphones and half on landlines. With the Cell-WINS flag, 15% of flagged-inactive cellphone numbers were found to be working and residential (false negatives), and one-in-ten flagged-active numbers were found to be non-working or non-residential (false positives). With the Targus flag, both error rates were higher.
In terms of coverage, we estimate that 8% of all working, residential cellphones in the U.S. are erroneously flagged as inactive with Cell-WINS, which is several percentage points higher than a previous study reported.1 For a national cellphone sample, this reduces the estimated net coverage rate of U.S. adults from about 91% to 83%. These net rates are based on estimates from the Centers for Disease Control and Prevention’s National Health Interview Survey that 3% of adults have no telephone, while another 6% have a landline but no cellphone (or unknown cellphone status). For national dual frame RDD surveys of adults, the inclusion of a landline sample substantially mitigates the estimated reduction in net coverage from excluding flagged-inactive numbers (from 97% coverage to 93%, rather than 83%).
While excluding flagged-inactive cellphones yields an undesirable reduction in the survey coverage rate, it does not appear to have a meaningful effect on bias, at least for public opinion surveys. Adults with cellphones erroneously flagged as inactive do differ systematically on several dimensions from those with flagged-active cellphones (e.g., younger, more racially diverse, less educated, lower income, less likely to be registered to vote), but they constitute too small a fraction of the population to meaningfully move estimates. In the 2014 survey, 2% of cellphone sample interviews and 1% of the combined sample interviews were with adults reached on numbers erroneously flagged as inactive using the Cell-WINS flag.
Pew Research Center has decided to forego using recent activity flags as standard practice in its polling – not out of concern about bias (we found very little), but out of concern for the population coverage rate. Maintaining the highest possible coverage rate has always been a priority in Pew Research Center work. For the time being, the potential efficiency gains do not justify the coverage rate reduction in our studies. We will continue to review this policy, however, as the cost/error trade-offs of telephone RDD work continue to evolve.
Identifying prepaid phone numbers
Another new service that telephone survey researchers have been testing identifies cellphone numbers that belong to prepaid or “pay as you go” cellphones. One reason that prepaid phones are of potential interest to survey researchers is that they are disproportionately used by demographic groups that are often underrepresented in telephone surveys. A recent Pew Research Center study found that prepaid phone users were more likely than other cellphone users to be non-white, lower income, less educated and live in urban areas.3
The share of cellphone numbers that are flagged as prepaid is relatively large. The Pew Research Center study, which used data from a national RDD survey fielded Feb. 18-22, 2015, with 526 adults interviewed on landlines and 978 interviewed on cellphones, found that 12.4% of all cellphone numbers dialed for the survey and 15.4% of the completed cellphone interviews were flagged as prepaid.
While the flag can be used to identify traditionally hard-to-reach groups, logistical factors limit its utility. Most notably, the prepaid phone flag is currently not available as a standalone product; one must purchase the aforementioned recent activity flag in order to have it appended. The fact that this flag is appended after the sample is drawn reduces its cost-effectiveness for demographic targeting purposes. For general population surveys, using the flag to oversample traditionally hard-to-reach groups is generally considered too costly and inefficient relative to other approaches. By contrast, for surveys of more narrowly defined populations (e.g., families receiving means-tested benefits), the prepaid phone flag may help to reduce the amount of screening required and prove to be a wise investment.
Geographic targeting with cellphones is improving
Another notable development is that accurate geographic targeting is increasingly possible with cellphone samples. A critical limitation of cellphone samples for research below the national level is that they suffer from both over- and under-coverage. Samples of cellphone numbers drawn for a particular area inevitably include people who do not live there (over-coverage). And depending on the area, significant numbers of people may live in the area but have cellphone numbers corresponding to a different geographic area (under-coverage).
We can illustrate these concepts using Pew Research Center’s second Religious Landscape Study (RLS), which was a national dual frame RDD survey of adults (n=35,071) conducted over the summer of 2014.4 Looking specifically at Colorado, a state with notable recent in-migration, we found that 18% of the cellphone respondents who reported living in Colorado were reached at a number assigned to a different state, and 14% of cellphone respondents with a Colorado number reported living in another state. If the RLS had been a state-level survey conducted only in Colorado, the 18% would represent under-coverage and the 14% would represent over-coverage.
The most fine-grained geographic variable on the standard cellphone RDD frame is the latitude and longitude of the rate center with which each cellphone number is associated. Sample vendors use these coordinates along with exchange-level information to create a variable for the county in which the cellphone user is most likely to live – based solely on their cellphone number. Previous work by Pew Research Center and another research team5 found that this county variable on the frame does not match the actual county of residence (based on self-reported ZIP code) for about four-in-ten cellphone respondents. This high error rate is attributable to the mobility of cellphones and how commonplace it is for people to move around the country while retaining their old cellphone number.
The first innovation in this area came when RDD sample vendors began appending the ZIP code of the cellphone’s billing address. This was a step forward because the ZIP code is based on where the current bill is being sent, as opposed to rate center location, which is based on where the phone was initially issued. One limitation of this service is that the billing ZIP code is not available for all numbers. A recent study estimated that the billing ZIP code was available for 60% of cellphone numbers in the U.S.6 A second limitation is that billing ZIP codes can be appended after the sample is drawn, which means that researchers have to pay for samples they end up not using. Despite these drawbacks, the billing ZIP codes have proven to be an effective tool for increasing the efficiency of state and local area cellphone RDD samples.
The next step in this geographic targeting evolution is obtaining a full address for cellphone numbers, not just a ZIP code. The first product to offer this is a convenience sampling frame called Consumer Cell. This frame, developed by Marketing Systems Group, is initially compiled from credit-based data and then crossed with proprietary sources to append cellphone numbers where available. This frame can be used to sample based on full address or an assortment of person- and household-level characteristics. The central limitation of this product is that it currently contains fewer than half of U.S. cellphone numbers, as opposed to the comprehensive coverage provided by the RDD cellphone frame. At present, one of the most promising applications of this product is in state and local surveys, as a means to partially remedy under-coverage in companion cellphone samples. Researchers can use this database to create an additional stratum for sampling people who live in the study area (based on the address) but have an out-of-area cellphone number.
Another sample vendor, Survey Sampling International, is making progress on appending the entire billing address to cellphone RDD samples. Their new product, named Super Cell, is still in development and currently being tested. The full billing address is expected to be available for the entire cellphone RDD frame apart from prepaid phones. It would allow for geographic targeting but also provide a unique opportunity to send advance materials to addresses from a cellphone sample.
Moreover, this enhanced cellphone sample frame will also contain demographic information from large consumer databases maintained by companies such as Experian. This feature could help telephone survey researchers target specific demographic groups more efficiently than they can using existing approaches. Finally, this enhanced frame is also expected to include the recent activity and prepaid cellphone flag, allowing for samples to be drawn based on these characteristics rather than having them appended after the fact.
Improving coverage of landlines
Innovations are also occurring with landline samples. For the past two decades, the standard approach for improving efficiency with landline RDD samples has been to restrict the sampling frame to blocks of 100 consecutive numbers (“100 blocks”) where at least one (or two or three) numbers are listed in a directory. However, as more and more landline numbers are unlisted, in part due to the proliferation in voice over internet protocol (VoIP) phones, research indicates that the list-assisted landline sample frame may have increasing coverage error due to the exclusion of numbers in 100 blocks with no directory-listed numbers (“zero banks”).78 To overcome the effects of this change, telephone sample vendors are now offering an “assignment-assisted” landline sample frame, where a 100 block is included in the frame if one of its numbers is assigned for use by a telecom company, regardless of whether it is directory-listed.
To test this new frame, Pew Research Center used an assignment-assisted landline sample for the 2014 RLS. A flag was included in the landline sample to indicate whether the number would have been included in a list-assisted landline sample frame. The study found that respondents only in the assignment-assisted landline sample frame were demographically distinct: They were younger, less educated, lower income, less likely to be registered to vote, more likely to be non-Hispanic black and more likely to live in an urban area. However, they only constituted 1% of the total landline sample and 1% of completed landline interviews. Thus, their incidence was too low to meaningfully affect survey estimates.
One potential risk of using the new frame was that it would contain more non-working numbers and, in turn, increase the cost of landline interviewing. This was not borne out in our study, however. On average, 40.4 landline numbers were dialed for every completed interview using the more inclusive assignment-assisted frame, which compares to an average of 40.2 numbers per completed interview when simulating the 1+ list-assisted landline frame. This difference was too small to have meaningful cost implications, at least for the types of surveys conducted by Pew Research Center. On balance, the slight improvement in coverage provided by the assignment-assisted frame is a positive development, though the net effect on data quality relative to using the 1+ list-assisted frame is barely perceptible.
Cumulative effects may not be negligible
Taken together, these advancements are promising in that they may help offset some of the increasing costs associated with RDD telephone surveys. It should be noted, however, that several of these approaches may systematically exclude certain segments of the public, depending on how they are implemented. In particular, excluding flagged-inactive cellphones and using the less comprehensive list-assisted landline frame both tend to slightly reduce representation of younger, non-white, lower-income, less educated and unregistered adults.
While each sampling strategy in itself may affect only a small fraction of the public and have a negligible effect on bias, researchers should be alert to the possibility that the cumulative effect on data quality from implementing several or all of these approaches may not be negligible. Rigorous assessments of these cost/error tradeoffs will likely need to be ongoing in order for researchers to strike an appropriate balance when designing their surveys.


