
Note: This 2022 fact sheet was part of the last update to our State of the News Media report. Find more updated survey data about local news in our “Local News Fact Sheet” here. Read archived reports on the State of the News Media from 2004-23 and the methodology here.
The transition to digital news consumption has hit the newspaper industry hard in recent years. Some national publications have managed to weather the storm in part by attracting digital subscribers, but many local newspapers have been forced to shutter their doors permanently, especially during the coronavirus pandemic.
To gain a clearer picture of how locally focused U.S. newspapers have fared in the digital age, Pew Research Center researchers reexamined data included in the Center’s State of the News Media newspapers fact sheet, excluding four publications that reach a large national audience. (Three of these four newspapers reach national audiences in addition to their respective local audiences.) These four publications – The New York Times, The Washington Post, The Wall Street Journal and USA Today – account for a large share of circulation in the newspaper industry and as such overshadow their locally focused counterparts in the data. Specifically, this analysis looks at economic data from publicly traded newspaper companies’ financial statements (2011-2020 for digital advertising revenue and 2013-2020 for total revenues), circulation data from Alliance for Audited Media (2015-2020), and digital audience data from Comscore (2014-2020). This addendum supplements the State of the News Media newspapers fact sheet, which presents the analysis at the overall industry level.
To gain a clearer picture of how local U.S. newspapers have fared the past few years, researchers reexamined the data used in the Center’s State of the News Media newspapers fact sheet to exclude several publications geared toward a national audience, even if they also report news for a particular region (The New York Times, The Washington Post, The Wall Street Journal and USA Today). Specifically, this analysis gives an overview of the state of local U.S. newspapers using circulation data from Alliance for Audited Media (AAM) for 2015-2020, revenue data from SEC filings of publicly traded newspaper companies (2011-2020 for digital advertising revenue and 2013-2020 for total revenues), and digital audience data from Comscore (2014-2020). Since Gannett (the parent company of USA Today) does not break out revenue by individual news brands in its SEC filings, USA Today could not be excluded from the revenue data. Please see the “Revenue” section for more details.
In this analysis, the four publications included in our definition of national newspapers account for a disproportionately large share of circulation in the newspaper industry. These four publications top the list for print readership in the Alliance for Audited Media data. Accounting for digital circulation is more difficult, however, given that three of these four publications do not fully report their digital circulation to AAM, as discussed previously in this Decoded post. The closest available measure of digital circulation is digital subscriptions, which The New York Times publishes in public SEC filings and The Wall Street Journal provides in audited statements on the Dow Jones website. The Washington Post, as a privately held company, does not publicly report its digital subscription numbers, although data will emerge sporadically in press reports. Each of these four publications – The New York Times, The Washington Post, The Wall Street Journal and USA Today – has digital subscription numbers in the millions, far surpassing metro publications with comparable print circulation, according to the best available public information. Removing the national-profile papers from the data provides a clearer view of publications operating on a more locally focused scale.
With these national publications excluded, researchers examined the circulation of over 600 daily U.S. newspapers that submit to regular circulation audits by AAM and revenues from SEC filings of five publicly traded newspaper companies that account for more than 300 U.S. daily newspapers. Researchers also examined digital traffic of the top 46 local daily U.S. newspapers with the highest circulation, according to AAM data. The digital traffic analysis includes only the top 46 papers by circulation since many daily newspapers do not receive enough traffic to their websites to be measured by Comscore, the data source relied on here.
Not all data sources in the State of the News Media newspapers fact sheet allowed researchers to remove specific publications. Some data in the main fact sheet is therefore not included in this analysis: employment data from the Bureau of Labor Statistics Occupational Employment and Wage Statistics, historical circulation data from Editor & Publisher, and historical revenue data from News Media Alliance. Because the historical circulation and revenue data could not be included in this analysis, the circulation and revenue figures presented here are not adjusted according to the historical data like they are in the main fact sheet. Rather, they are presented as originally reported by AAM and companies’ SEC filings.
Read the full State of the News Media methodology.
This locally focused analysis shows that many of the trends apparent in the overall newspaper industry hold true for local U.S. newspapers as well.
Audience
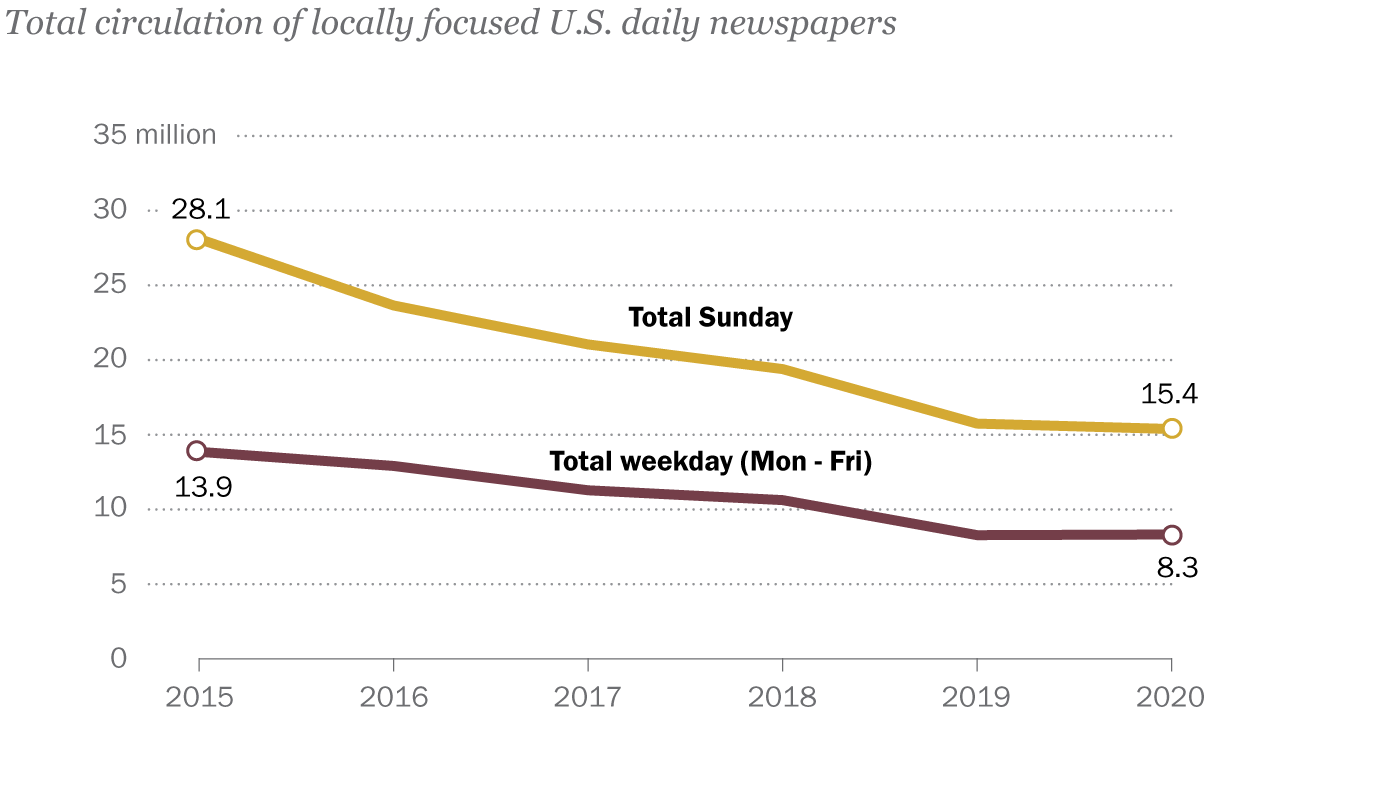
The total combined print and digital circulation for locally focused U.S. daily newspapers in 2020 was 8.3 million for weekday (Monday-Friday) and 15.4 million for Sunday. Each of these numbers is roughly on par with the previous year, but they are still among the lowest reported: Total weekday circulation is down 40% since 2015, the first year available for this analysis. Similarly, total Sunday circulation has fallen 45% since 2015.
Within those overall declines is a more complex relationship between print and digital circulation. Print weekday circulation in 2020 was down 12% from 2019, while print Sunday circulation declined 10%.
In contrast, digital weekday circulation was up 30% in 2020, and digital Sunday circulation climbed 29%. The 2020 increases for digital circulation are the greatest year-over-year increases for digital since 2015. Overall, digital weekday circulation has grown 21% since 2015, and digital Sunday circulation has increased 27%.
Print, meanwhile, experienced a steady decline in both weekday and Sunday circulation between 2015 and 2020, falling 55% for print weekday during this time and 54% for print Sunday.
To get a clearer picture of the digital audience for locally focused publications, researchers reexamined the Comscore data included in the State of the News Media newspapers fact sheet by removing newspapers with a national audience from the analysis (The New York Times, The Washington Post, The Wall Street Journal and USA Today). This updated analysis of locally focused daily U.S. newspapers includes the remaining top 46 publications based on their circulation.1
| Year (Q4) | Average monthly unique visitors |
|---|---|
| 2014 | 5,270,693 |
| 2015 | 5,691,344 |
| 2016 | 6,400,664 |
| 2017 | 6,821,214 |
| 2018 | 6,474,308 |
| 2019 | 6,935,309 |
| 2020 | 7,574,228 |
In the fourth quarter of 2020, there were an average of 7.6 million monthly unique visitors to these 46 local news sites, up 9% from 2019. (When the four national publications above are included, newspapers received 13.9 million unique online visitors in the fourth quarter of 2020, up 14% from 2019.)
The average number of monthly unique visitors to local news websites has increased 44% since the fourth quarter of 2014, the first year in our data.
The increase in the number of visitors to locally focused news sites has been accompanied by a simultaneous decline in the duration of those visits – a pattern that exists for the newspaper industry overall. In the fourth quarter of 2020, the average minutes per visit to the websites of local papers was 1.8 minutes, compared with 2.1 minutes in Q4 2019. This is a 13% year-over-year decline, the steepest drop in minutes per visit since Q4 2014, the first year in our data.
| Year (Q4) | Average minutes per visit |
|---|---|
| 2014 | 2.50 |
| 2015 | 2.53 |
| 2016 | 2.40 |
| 2017 | 2.38 |
| 2018 | 2.31 |
| 2019 | 2.08 |
| 2020 | 1.81 |
Overall, the average duration of visits to local news websites has declined 41 seconds since Q4 2014, similar to the overall decrease of 45 seconds in the broader industry.
Revenue
The total advertising revenue for locally focused U.S. daily newspapers in 2020 was $1.07 billion, based on the Center’s analysis of financial statements for publicly traded newspaper companies.2 This is down 40% from 2019, much steeper than the 25% decline the overall newspaper industry experienced during the same time. Total circulation revenue was $1.1 billion in 2020 for local newspapers, compared with $1.5 billion in 2019. As is also seen in the overall industry, 2020 was the first year local newspaper advertising revenue fell below circulation revenue.
In the revenue charts above, data is pulled directly from year-end Securities and Exchange Commission filings of five publicly traded newspaper companies. In 2019 and 2020, that includes the following: Belo, Lee, Tribune, McClatchy (2019 only) and Gannett. Since Gannett does not break out revenue by individual news brands in its SEC filings, USA Today could not be excluded from this part of the analysis. The Washington Post and The Wall Street Journal are not publicly traded and do not file public financial reports with the SEC. For this reason, The Washington Post and The Wall Street Journal are not part of the revenue analysis here or in the Center’s State of the News Media newspapers fact sheet. Revenue figures from The New York Times have been excluded.
| Year | Advertising | Circulation |
|---|---|---|
| 2013 | $4,033,114,000 | $1,947,936,000 |
| 2014 | $4,669,287,000 | $2,352,006,000 |
| 2015 | $3,999,011,000 | $2,322,594,000 |
| 2016 | $4,004,563,000 | $2,569,678,280 |
| 2017 | $3,776,232,050 | $2,689,934,680 |
| 2018 | $3,077,386,330 | $2,459,659,198 |
| 2019 | $1,788,180,000 | $1,527,928,000 |
| 2020 | $1,068,602,000 | $1,114,547,000 |
Digital advertising accounted for 35% of advertising revenue for locally focused U.S. newspapers in 2020, based on this analysis of publicly traded newspaper companies. That share is roughly on par with the 39% of ad revenue coming from digital ads in the overall industry. For local newspapers, the share of ad revenue coming from digital has grown steadily from 15% in 2011, the first year in our data.
| Year | % |
|---|---|
| 2011 | 15 |
| 2012 | 17 |
| 2013 | 19 |
| 2014 | 19 |
| 2015 | 23 |
| 2016 | 28 |
| 2017 | 29 |
| 2018 | 32 |
| 2019 | 31 |
| 2020 | 35 |