
Measuring vote preference in 2020 presidential election
Vote preference among registered voters in this report comes from a survey conducted Sept. 30-Oct. 5, 2020, among 10,543 registered voters. Of these registered voters, 8,501 also took the survey conducted Oct. 6-12 that is analyzed in this report. The initial survey asked U.S. citizens: “If the 2020 presidential election were being held today, would you vote for…” and gave the options of “Donald Trump, the Republican,” “Joe Biden, the Democrat,” “Jo Jorgensen, the Libertarian Party candidate,” “Howie Hawkins, the Green Party candidate” (in states where he appears on the ballot) and “vote for none/other.” Respondents who selected “vote for none/Other” or who skipped the first question were asked a follow-up question, “As of TODAY, do you…,” and then given the option to indicate if they “lean more toward” any of the candidates included in the first question.
Trump supporters are defined as U.S. citizens who are certain they are registered to vote who said they would either vote for Trump or who lean more toward voting for him. Biden supporters are defined as U.S. citizens who are certain they are registered to vote who selected Biden in either of the two questions.
For more about these questions on vote preference in the 2020 presidential election, see this report.
Grouping respondents by major news sources
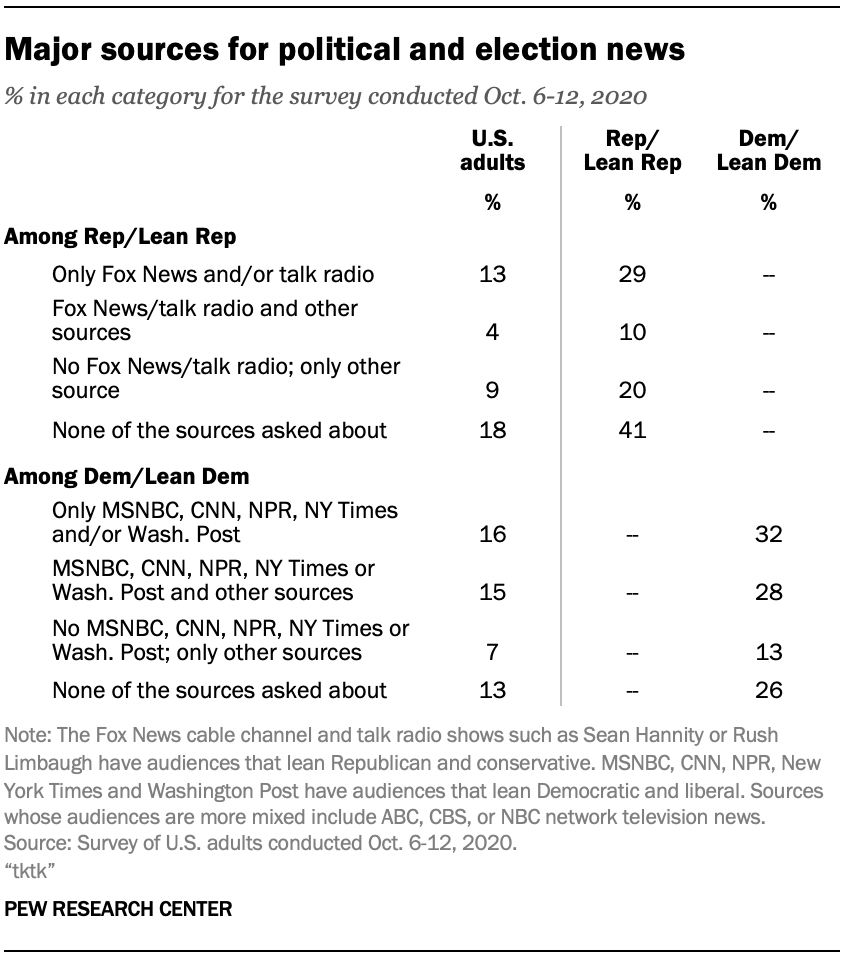
A survey conducted Aug. 31-Sept. 7, 2020, asked whether respondents use any of eight news sources as a major source, minor source or not a source for political and election news. (Responses for all eight sources are available here.) The sources identified as major sources were combined with the respondents’ partisanship to identify those who get news from only sources with audiences that lean toward their party (i.e., Republicans who get news only from sources with right-leaning audiences and Democrats who only get news from sources with left-leaning audiences) or another mix of sources. Those who do not use any of the eight sources asked about as a major source for political and election news are in a separate category. Researchers merged the responses to these questions from late August and early September to the survey data collected Oct. 6-12, 2020.
The eight sources asked about are:
- Fox News cable channel
- CNN
- MSNBC
- ABC, CBS or NBC national network TV
- NPR
- The New York Times
- The Washington Post
- Talk radio, such as Sean Hannity or Rush Limbaugh
Sources were selected from among the top responses (used by about 10% or more of U.S. adults) to a question from November 2019 asking if respondents got news from each of 30 different sources in the past week. More details about this measure and what it reveals about Americans’ news habits are available here, and all data for the question is available here.
The eight sources asked about were then classified according to the political partisanship and ideology of their audiences. For this analysis, respondents who call each source a “major source” for political and election news are considered part of its audience.
An outlet is considered to have a left-leaning audience if the proportion of all audience members that identify as liberal Democrats is at least two-thirds higher than the proportion who identify as conservative Republicans. Alternatively, an outlet is considered to have a right-leaning audience if the proportion of all audience members who identify as conservative Republicans is at least two-thirds higher than the proportion that identify as liberal Democrats. An outlet is classified as having a mixed audience if neither liberal Democrats nor conservative Republicans make up at least two-thirds more of the audience than the other.
Respondents who did not complete the survey conducted Aug. 31-Sept. 7, 2020 are not included in the analysis using these media habits.


