This Pew Research Center analysis is based on surveys of parents and teens that were conducted using the NORC AmeriSpeak panel. AmeriSpeak is a nationally representative, probability-based panel of the U.S. household population. Randomly selected U.S. households are sampled with a known, nonzero probability of selection from the NORC National Frame, and then contacted by U.S. mail, telephone and field interviewers (face to face). More details about the NORC AmeriSpeak panel methodology are available here.
This particular survey featured interviews with 1,058 parents who belong to the panel and have a teen ages 13 to 17, as well as interviews with 743 teens. Parents who have multiple teenage children were asked to provide information about each of these teens. The panel randomly selected one of these teens, and parents were instructed to respond to all survey questions with this teen in mind. Interviews were conducted online and by telephone from March 7 to April 10, 2018.
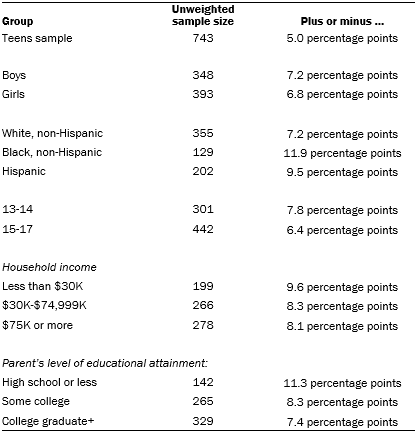
The margin of sampling error is plus or minus 5.0 percentage points for the full sample of 743 teen respondents and 4.5 percentage points for the full sample of 1,058 parent respondents.
The data were weighted in a multistep process that begins with the panel base sampling weights. Panel base sampling weights for all sampled housing units are computed as the inverse of probability of selection from the NORC National Frame (the sampling frame that is used to sample housing units for AmeriSpeak) or address-based sample. The sample design and recruitment protocol for the AmeriSpeak Panel involves subsampling of initial nonrespondent housing units. These subsampled nonrespondent housing units are selected for an in-person follow-up. The subsample of housing units selected for the nonresponse follow-up (NRFU) have their panel base sampling weights inflated by the inverse of the subsampling rate. The base sampling weights are further adjusted to account for unknown eligibility and nonresponse among eligible housing units. The household-level nonresponse adjusted weights are then post-stratified to external counts for number of households obtained from the U.S. Census Bureau’s Current Population Survey. Then, these household-level post-stratified weights are assigned to each eligible adult in every recruited household. Furthermore, a person-level nonresponse adjustment accounts for nonresponding adults within a recruited household. Teen panelists carry over the parent’s panel weight.
Finally, panel weights were raked to external population totals associated with age, sex, education, race/Hispanic ethnicity, housing tenure, telephone status and census division. The external population totals were obtained from the Current Population Survey. The weights adjusted to the external population totals are the final panel weights.
Study-specific base sampling weights are derived using a combination of the final panel weight and the probability of selection associated with the sampled panel member. Since not all sampled panel members respond to the survey interview, an adjustment is needed to account for and adjust for survey nonrespondents. This adjustment decreases potential nonresponse bias associated with sampled panel members who did not complete the survey interview for the study. Thus, the nonresponse-adjusted survey weights for the study were adjusted via a raking ratio method to general population totals associated with the following socio-demographic characteristics: age, sex, education, income, race/Hispanic ethnicity and census division for the parent respondents, and the following socio-demographic characteristics for the teen respondents: age, sex, race/Hispanic ethnicity, highest level of education associated with teen’s parents and census division associated with the teen’s household. The weights adjusted to the 2017 March Current Population Survey population totals are the final study weights, which were used to produce the estimates in this report.
The following table shows the unweighted sample sizes and the error attributable to sampling that would be expected at the 95% level of confidence for teens and parents in the survey:

In addition to sampling error, one should bear in mind that question wording and practical difficulties in conducting surveys can introduce error or bias into the findings of opinion polls.
The parent survey had a survey completion rate of 83% (1,058 completed interviews out of 1,274 screened eligible panelists). Taking account of the combined, weighted response rate for the recruitment surveys (34%) and attrition from panel members who were removed at their request or for inactivity, the weighted cumulative response rate for the parent survey is 8%.
The teen survey had a survey completion rate of 69% (743 completed interviews out of 1,075 screened eligible panelists for whom parental consent was granted). Taking account of the combined, weighted response rate for the recruitment surveys (34%) and attrition from panel members who were removed at their request or for inactivity, the weighted cumulative response rate for the teen survey is 18%.
Pew Research Center is a nonprofit, tax-exempt 501(c)(3) organization and a subsidiary of The Pew Charitable Trusts, its primary funder.
© Pew Research Center, 2018


