
Those who allowed us to access their Facebook logs gave us a chance to explore a more extensive set of Facebook activities than we could capture through a phone survey. We were able to explore the frequency of these activities, how activities are related to the size of people’s Facebook friends list, how long they have used Facebook, how they responded to similar questions about Facebook activities in our survey, and variation in use by gender.
A consistent trend in our analysis is the lack of symmetry in Facebook activities. On average, Facebook users in our sample received more than they gave in terms of friendships and feedback on the content that is shared in Facebook. However, these averages need to be interpreted in context. This imbalance is driven by the activity of a subset of Facebook users who tend to be more engaged with the Facebook site than the typical user.
Our findings suggest that while most Facebook users in our sample were moderately active over a one-month time period, there is a subset of Facebook users who are disproportionately more active. They skew the average. These power users, who, depending on the type of content, account for 20% to 30% of Facebook users in our sample, ”like” other users’ content, tag friends in pictures, and send messages at a much higher rate than the typical Facebook user. Power users tend to specialize. Some 43% of those in our sample were power users in at least one Facebook activity: sending friend requests, pressing the like button, sending private messages, or tagging friends in photos. Only 5% of Facebook users were power users on all of these activities, 9% on three, and 11% on two. It is this intensive set of users on each activity that explains why, when we look at the average amount of content sent and received in a month, it appears that Facebook user tends to receive more than they give.
Making nearly seven new friends a month
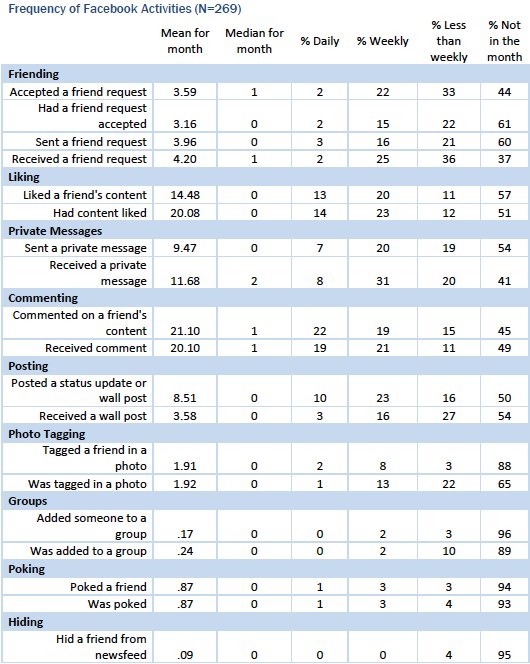
In general, people in our sample were more likely to receive a friend request than to initiate one of their own. About 40% of our sample of Facebook users made a friend request in the month of our observation, but 63% of users received a friend request. While most users did not initiate a friend request, and most received only one, 19% of users – what we are calling power users – initiated requests at least once per week. Not all friend requests were reciprocated; 80% of friend requests that were initiated were accepted.
As a result of the intensive activity of the 19% of Facebook users who were very prolific at initiating friend requests, Facebook users on average (mean) had three friend requests that they initiated accepted, and they accepted an additional four friend requests from other users. On average, our sample of Facebook users made seven new friends per month.
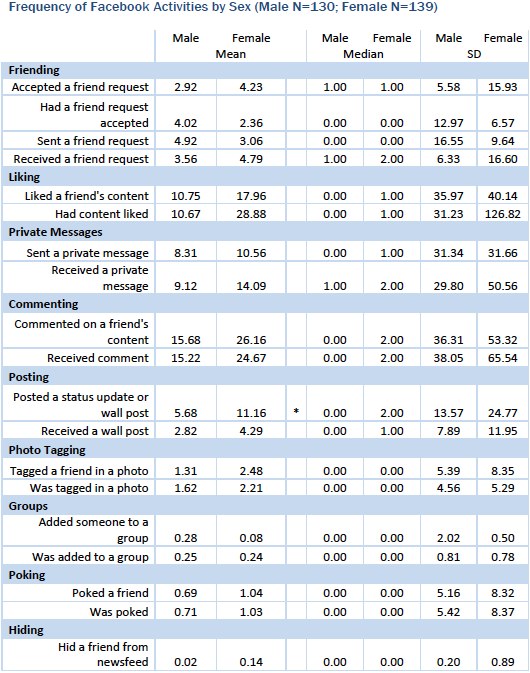
In general, men were more likely to send friend requests, and women were more likely to receive them. However, we did not find a statistical difference in the mean number of friend requests sent, received, or accepted between men and women. We suspect, if we had a larger sample and could examine users by both age and gender, we would find that among younger users there is a tendency, consistent with stereotypical norms, for men to initiate friend requests with women at a higher rate than women initiate contact with men.
People are liked more than they like
Use of the “like” button is among the most popular activities on Facebook. A third of our sample (33%) used the like button at least once per week during this month, and 37% had content they contributed liked by a friend at least once per week. However, the majority of Facebook users neither liked content, nor was their content liked by others, in our month of observation.
Use of the like button is unequally distributed. Because of the intensive activity of the 30% of power users, the people in our sample pressed the like button next to friends’ content on an average of 14 occasions during the month and received feedback from friends in the form of a “like” 20 times during the month.
This discrepancy is a function of two things. First, an intensive subset of Facebook users are heavily engaged with the use of the “like” button. Nearly 5% of our sample pressed the like button next to content on friends’ walls on over 100 occasions in a month. Second, the average number of received likes is skewed as a result of a small number of people who are extremely well “liked” – their content was especially popular over the month. That is, their content receives a very high number of likes from friends. About 3% of our sample had content liked by their friends on over 100 occasions in the month (one user received well over 1,000).
[2]
People receive more messages then they send
Facebook allows users to send private messages to each other. During this time period among these Facebook users, there is an absence of reciprocity in how people use personal messages. In general, people receive more messages than they send. Over half of Facebook users in our sample (54%) did not send a private message in the month, but 59% did receive a message. A subset of 27% of Facebook power users sent a personal message at least once per week (39% of Facebook users received at least one message per week). As a result of these power users, in the month of our analysis, the Facebook user in our sample on average received nearly 12 private messages, and sent just over nine.
More feedback than updates
Status updates are broadcasts posted to one’s own Facebook profile that appear in friends’ newsfeeds. In our sample, status updates are a far less frequently used activity than either commenting on others’ content or using the like button. Facebook users in our sample on average contributed about four comments for every status update that they made. On average, users make nine status updates per month and contribute 21 comments. Some 33% of Facebook users here updated their status at least once per week. Still, half of our sample made no status updates in the month of our analysis.
Women make significantly more status updates than men; the average female in our sample made 11 status updates, while the average male made six.
More likely to be tagged than to tag a friend in a photo
Tagging friends in photos uploaded into Facebook is not a frequent activity of most Facebook users in our sample over the time that we were able to observe. Only 12% of our sample tagged a friend in a photo in the month of our analysis. However, while few do the tagging, 35% of users were themselves identified and tagged in a photo by a Facebook friend.
To join or be joined
[4, 5]
Give a comment, receive a comment
There were some Facebook activities where people were as likely to give as they were to receive. Unlike use of the “like” button, there is a trend toward balance in the tendency to receive comments and post comments on friends’ content. More than half our sample (55%) commented on a friend’s content at least once in the month, and 51% received comments from a friend. A large segment of users, a little over 20%, contributed or received a comment every day. The average of 21 comments given on friends’ content was nearly identical to the average of 20 that were received. Again, there are some extreme users as well, about 5% of our sample contributed and received over 100 comments in the month of our observation.
Poke them back
Among the least commonly practiced Facebook activities is the use of the “Poke” button. Only 6% of users poked a friend, while 7% were poked in the month. While uncommon, some Facebook users are frequent pokers. Five participants from our sample poked nearly once a day, being poked themselves a nearly equal number of times.
When “friends” are not friends after all
Facebook users have the ability to unsubscribe from seeing content contributed by specific friends on their newsfeed. Data on our sample of Facebook users suggest that this featured is used by a small minority of Facebook users. In our sample, only 12 respondents, or less than 5% of Facebook users, hid another user from their feed in the month of our observations. Nine users hid a single friend, and three blocked more than one friend.
Facebook users underestimate their number of Facebook friends
[6]
When we compare the size of people’s Facebook networks as they reported on the survey with their actual friend count, we found that the average respondent underestimated by about 18 friends. Those in our sample reported on the phone survey they had an average of 227 friends, but Facebook logs show that this sample of people actually has an average of 245 friends. The correlation between actual Facebook friends and the number reported on the survey was very high.2 This suggests that individual survey responses are generally consistent with the size of actual Facebook friends lists.
However, while highly correlated with actual size, we note that roughly one-third (32%) of respondents were still more than 50% wrong in their self-reports – that is, they over or underestimated their number of friends by more than 50% of the actual size. We did not find any tendency for people with larger Facebook friends lists, or those who had been on Facebook longer, to be any more or less accurate in their reports than those with smaller networks or those who started using Facebook more recently.
Friendship numbers drive Facebook activity
When we looked at the relationship between the size of people’s friends lists and how often they participate in various Facebook activities, the relationship was universally in one direction. The more Facebook friends people have, the more they perform every activity on Facebook.
Those who have more Facebook friends tend to send and accept more friend requests, receive more friend requests, and have more friend requests accepted. They “like” their friends’ content more frequently, and are “liked” more in return. They send and receive more private messages, send and receive more comments, post and receive wall posts more frequently, tag and are tagged in more photos, and are added to more groups (see Appendix A: Table 1).
The time passed since people first started using Facebook is associated with more frequent posting, commenting, and photo tagging
There is no evidence in this sample that veteran users of Facebook suffer from Facebook fatigue. There is a weak to modest, positive relationship between length of time using the site and frequency of using the “like” button, commenting on friends’ content, posting status updates or wall posts, and tagging friends in photos. Similarly, the longer members of our sample had been using Facebook, the more likely they were to have their content liked by a friend, receive a comment, receive a wall post, or have themselves tagged in a photo.
Somewhat surprisingly, there is no relationship between how long people have been using Facebook and how frequently they get or send friendship requests. There is however, a weak relationship between length of time using Facebook and likelihood of hiding a friend’s content on the Facebook newsfeed.
For a detailed look at these correlations, see Table 1 in Appendix A to the report.
Most users have a good sense of how they use the Facebook service
Survey participants were asked to self-report the frequency that they participate in a number of common Facebook activities. We asked survey participants how often they clicked the “like” button, how often they sent private messages, how often they posted a status update or a comment on someone else’s wall, and how often they commented on another user’s content. The response categories that we provided included “several times a day,” “about once a day,” 3-5 days a week,” “1-2 days a week,” “every few weeks,” “less often,” and “never.”
Using data that participants agreed to share from their Facebook accounts, we paired data on actual use of Facebook with the response categories we provided in the survey. This allowed us to explore the accuracy of self-reported survey data, and to better understand how aware Facebook users are of how often they use the Facebook service.
In general, most self-reports of Facebook activity were accurate, or close to actual usage. For each activity, one quarter to one third of participants correctly identified the category of use that matched their actual use. An additional one quarter to one third of users were off by only one category. There was no statistical difference between the proportion of users who self-reported that they did an activity “several times a day” or “about once a day,” and actual use, across all activities we measured on the survey. With the exception of commenting, the same was true for those who reported doing activities “3-5 days a week” (see Appendix A: Table 2).
[7]
There is a strong, positive relationship between actual use and reported use of the “like” button3 and for commenting on other users’ content4. The relationship was more moderate, but still positively correlated for less frequent activities, such as private messaging5 and status updates or wall posts6. This suggests that self-report data is generally consistent with actual use, especially for the most popular Facebook activities – such as use of the “like” button.


