Introduction and findings
Results from the overall Pew Internet survey show that technology users are generally more likely than non-users to be involved in almost all the kinds of groups. In the survey, 76% of adults reported being internet users; 81% said they had cell phones; and 59% said they connect to the internet wirelessly either through their laptop computer or through their smart phone. Results also showed that the internet is deeply embedded in group activities and in how people create, join, participate in, and sustain groups.
To start, we note that 79% of those who are active in religious and spiritual organizations use the internet. That is not statistically different from the internet use of those who are not part of such organizations (76%).
Their view of the internet’s impact on their overall group involvement – not just their involvement with religious and spiritual organizations – is also in line with overall population averages, as pictured in Figure 10.
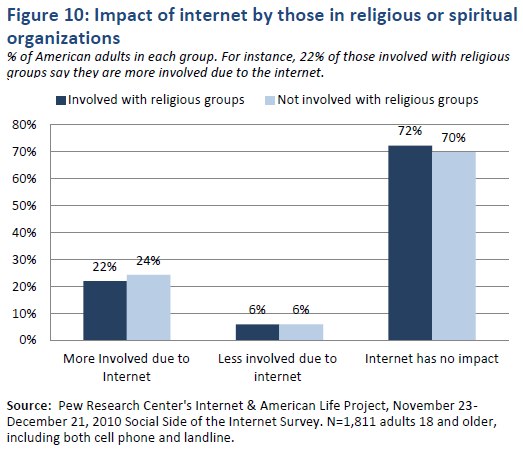
As shown Figure 10, 22% of those active in religious or spiritual groups reported that the internet propels them to more involvement with the groups that matter to them, with 72% saying the internet had no impact. These percentages are similar to those from respondents not active in religious or spiritual groups.
When we examined the use of social network services, however, there were some minor differences between those internet users in religious or spiritual groups versus other groups.
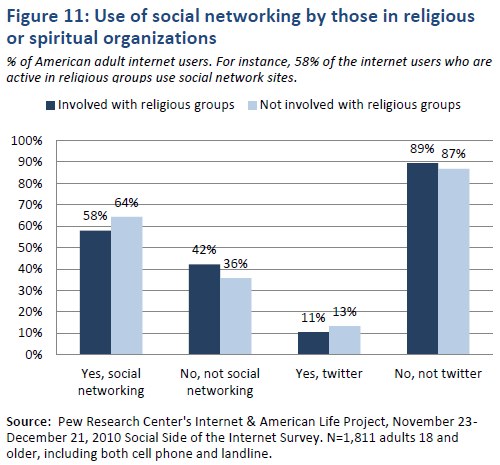
As shown in Figure 11, 58% of the internet users who are active in religious groups use social network sites compared with 64% for the online Americans who are not active in religious or spiritual groups. This lower usage level may be correlated with age. Older Americans tend to use social networking sites less than younger Americans7, and those active in religious or spiritual groups tend to be older (average age of 49 versus 43 years for those not active in religious organizations).
There was no significant difference concerning the use of Twitter among those active in religious or spiritual groups (11%) and those not (13%).
So, it appears that those active in religious or spiritual groups embrace digital technology more or less at rates similar to the overall population, once one accounts for the age difference. This is in line with other research that has examined technology usage around religion and the internet8, finding no significant difference.
Differences in levels of religious involvement
Since being active in a religious group can cover a range of commitment levels, we examined those who are engaged with religious organizations often (i.e., weekly), those who are less frequent attendees (i.e., monthly), and those who don’t connect at all (i.e., less often than monthly or never). Specifically, we asked “Aside from weddings and funerals, how often do you attend religious services… more than once a week, once a week, once or twice a month, a few times a year, seldom, or never?” Based on the responses to this question, we examined several key aspects based on attendance rate at religious services. Figure 12 shows a comparison based on attendance at religious services and several measures of engagement and well-being.
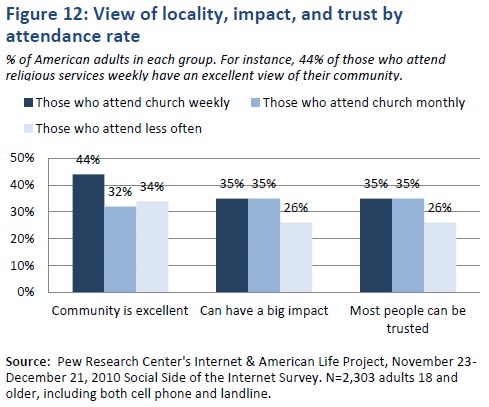
From Figure 12, those that attend religious services weekly are significantly more likely to have an excellent view of their community (44%) relative to those who attend monthly (32%) or do not attend at all (34%).
Those attending religious services weekly or monthly are significantly more likely to believe that they can have a major impact (35%) and that most people can be trusted (35%) relative to those who do not attend religious services (26%).
We looked at involvement level (i.e., number of groups belonged to) by attendance at religious services.
Again, we classified people into four categories, depending on how many groups they were involved with based on the 28 different kinds of groups covered in the survey:
- High Involvement: those who participate in 8-28 groups
- Medium Involvement: those who participate in 3-7 groups
- Low Involvement: those who participate in 1-2 group(s)
- No Involvement: those who participate in 0 groups
Findings are shown in Figure 13.
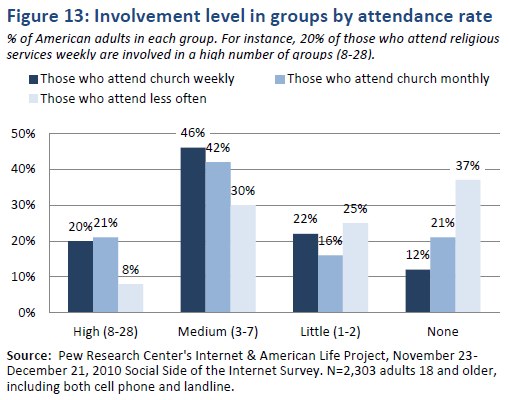
As shown in Figure 13, there is a definite correlation between attendance at religious services and general involvement with groups. Those that attend services either weekly or monthly are significantly more likely to be involved in a high or medium number of groups relative to those that do not attend religious services. Only 8% of those who do not attend religious services are involved in a high number of groups.
We also looked at the rates of participation in certain types of group activities by attendance at religious services, as shown in Figure 14.
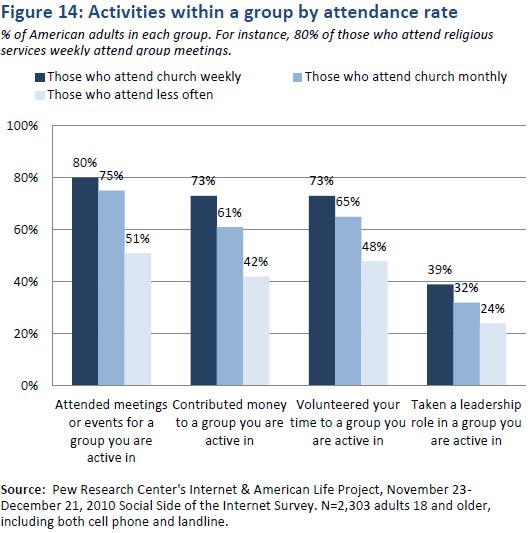
From Figure 14, there is again a correlation between frequency of attendance at religious services and participation in key group activities. Those that attend religious services weekly are much more likely to attend group meetings (80%), contribute money (73%), volunteer time (73%), or take a leadership role (39%) relative to those who attend monthly church or not at all.
Findings for cell phone usage by attendance at religious services are shown in Figure 15.
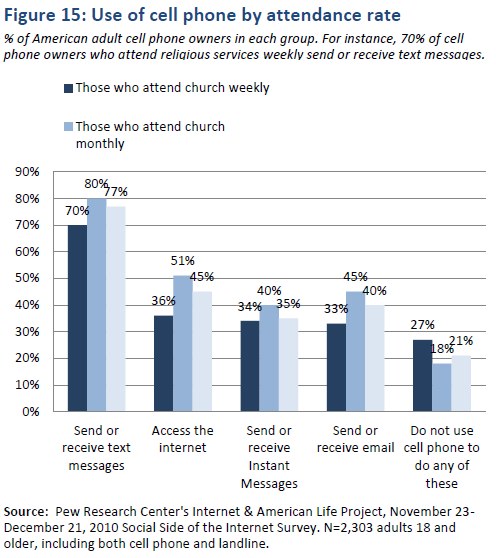
From Figure 15, we see that the cell phone owners who attend religious services monthly were heavy users of their cell phone in a variety of tasks, including texting (80%), accessing the internet (51%), instant messaging (40%), and emailing (45%). Only 18% of the cell owners who attend monthly religious services did not use their cell phones for any of these tasks.
So, in terms of technology usage, those who attend religious services monthly were heavier users of cell phone services that those whose attend more frequently or less often.
For all tasks we surveyed, those with cell phones who attended weekly services were less likely to engage in such tasks, and 27% of these Americans did not use their cell phones for any of these tasks.
We also examined the use of social networking sites by those who attend religious services, with results shown in Figure 16.
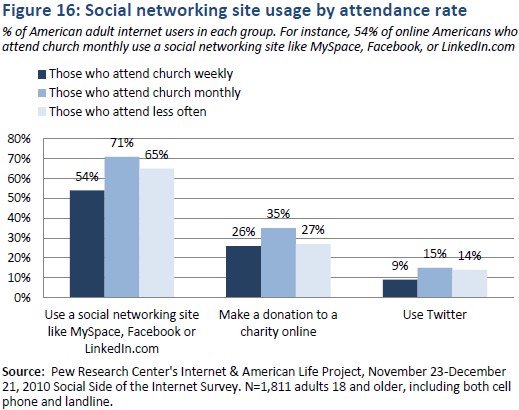
In Figure 16, we see a similar pattern as cell phone usage and technology ownership with the online Americans who attend religious services monthly more likely to use Facebook (71%) and Twitter (15%) those attending weekly services (54% for Facebook ad 9% for Twitter) or those not attending any religious services (65% for Facebook and 14% for Twitter).
As noted earlier, age may be a factor in these lower usage levels for frequent church attendees.
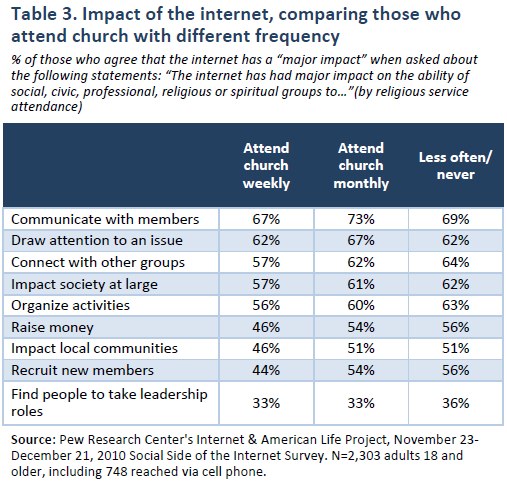
In Table 3, we show percentages for the impact of the internet on a variety of group activities based on attendance rate at religious services.
Similar to the usage patterns of some technologies, we see that those who attend monthly religious services generally have stronger views of the internet having a major impact.
Comparison of those active in religious or spiritual organizations, those in other organizations, and those belonging to no organizations or groups
There are 25% of American’s who are active in no group or organization. So, we were interested in separating these people out, comparing those who are:
- Active in religious or spiritual organizations
- Active in organizations but not religious or spiritual groups
- Not active in any organization
We examined three key aspects, (a) view of community, (b) whether others can be trusted, and (c) use of the internet.
Looking first at how respondents view their community in Figure 17, we see that there are significant differences among the three groups.
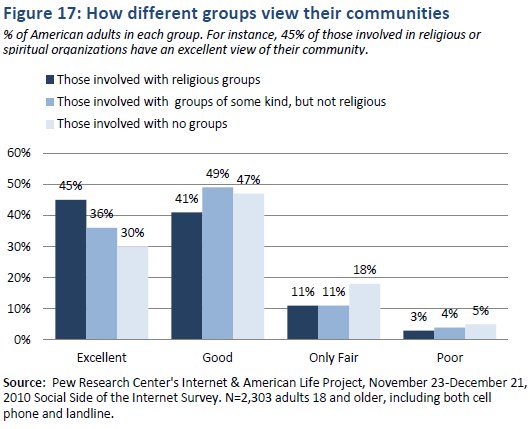
We see in Figure 17, 45% of those involved in religious or spiritual organizations have an excellent view of their community, compared with 36% of those active in groups or organizations (but not religious groups) and 30% of those active in no groups at all.
We see a similar trend in people’s view of the trustworthiness of others (Figure 18).
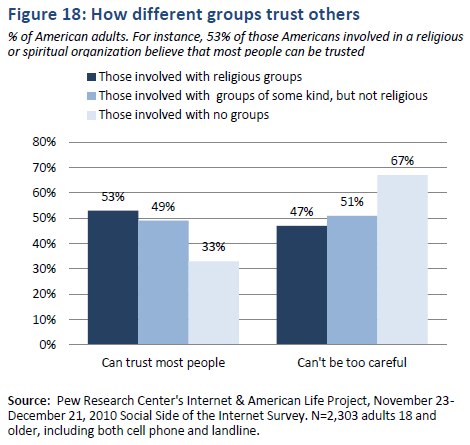
In Figure 18, 53% of those Americans involved in a religious or spiritual organization believe that most people can be trusted. This compares to 49% of those who are active in non-religious groups and 33% for those who are do not are active in any organization.
Summary and Implications
Given the impact of religion on many aspects of our society, we set out to examine aspects of the social ties of the religious and spiritual in American. Our results show that 40% of Americans active in a religious or spiritual organization, by far the largest percentage membership for any type of group or organization.
Americans active in these religious or spiritual organization are generally older, more educated, and with higher household incomes than those not involved in such organizations.
While there is a correlation between group involvement and positive outlook (in general, regardless whether or not the group is religiously-related), there appears to be something unique about those involved with religious or spiritual organizations. These people are active in more organizations and devote more time to these organizations than their counterparts who are not involved in religious or spiritual groups. So, demographically, these appear to be individuals that one would want to recruit or get involved in group, organizational, or community activities.
Additionally, these religious or spiritual group members are more likely to believe others are trustworthy, more likely to say they like the communities in which they live are excellent, and more likely to believe they can make a positive impact on their communities. They are also the most likely to have lived in their communities for an extended period.
Politically, about half are conservative, with the other half being moderate or liberal. So, the view proposed by some that the religious are an overwhelming conservative block is not evident in this survey, though they do trend conservative.
Concerning technology usage, those active in religious or spiritual organizations use the internet in the same percentages as the general population. More than half of the religiously active who are on the internet are users of social network sites. They own cell phones in percentages greatly than the overall population. So, it appears that members of religious organizations embrace technology like their non-religious counterparts, although there are some controlling factors such as age and income that do come into play.
Naturally, in complex situations like social interactions and involvement, it is rare that a single variable is totally responsible for explaining the nuances of an individual’s decision or course of action. However, from this analysis, involvement in church, religious, or spiritual organizations appears positively correlated with a variety of attitudes, technology usage, and behaviors, including increased trust, increased belief in impact, online and offline participation, and time commitment or groups or organizations.


