
Main findings
Cell phone use in the U.S. has increased dramatically over the past decade. Fully eight in ten adults today (82%) are cell phone users, and about one-quarter of adults (23%) now live in a household that has a cell phone but no landline phone.
Along with the widespread embrace of mobile technology has come the development of an “apps culture.” As the mobile phone has morphed from a voice device to a multi-channel device to an internet-accessing mini-computer, a large market of mobile software applications, or “apps,” has arisen.
Among the most popular are apps that provide some form of entertainment (games, music, food, travel and sports) as well as those that help people find information they need and accomplish tasks (maps and navigation, weather, news, banking). With the advent of the mobile phone, the term “app” has become popular parlance for software applications designed to run on mobile phone operating systems, yet a standard, industry-wide definition of what is, and is not, an “app” does not currently exist. For the purpose of this report, apps are defined as end-user software applications that are designed for a cell phone operating system and which extend the phone’s capabilities by enabling users to perform particular tasks.
The most recent Pew Internet Project survey asked a national sample of 1,917 cell phone-using adults if they use apps and how they use them. Broadly, the results indicate that while apps are popular among a segment of the adult cell phone using population, a notable number of cell owners are not yet part of the emerging apps culture.
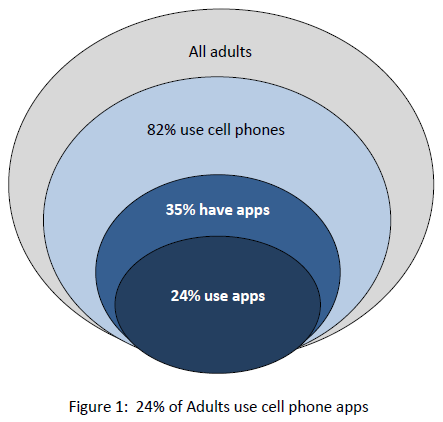
35% of adults have cell phones with apps, but only two-thirds of those who have apps actually use them
Of the 82% of adults today who are cell phone users, 43% have software applications or “apps” on their phones. When taken as a portion of the entire U.S. adult population, that equates to 35% who have cell phones with apps. This figure includes adult cell phone users who:
- have downloaded an app to their phone (29% of adult cell phone users), and/or
- have purchased a phone with preloaded apps (38% of adult cell phone users)
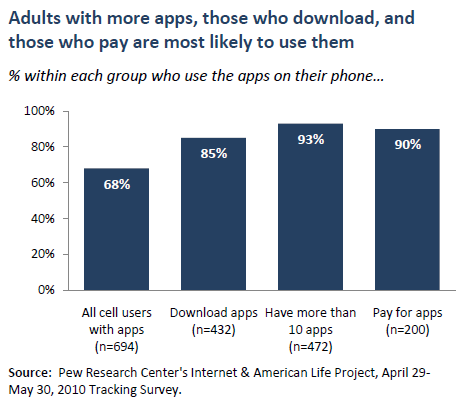
Yet having apps and using apps are not synonymous. Of those who have apps on their phones, only about two-thirds of this group (68%) actually use that software. Overall, that means that 24% of U.S. adults are active apps users. Older adult cell phone users in particular do not use the apps that are on their phones, and one in ten adults with a cell phone (11%) are not even sure if their phone is equipped with apps.
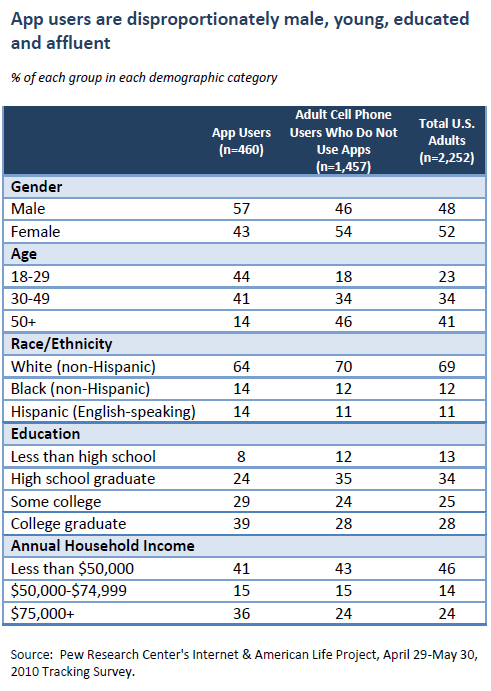
Apps users are younger, more educated, and more affluent than other cell phone users
When compared with other cell phone using adults, and the entire U.S. adult population, the apps user population skews male, and is much younger, more affluent, and more educated than other adults. Overall, the apps-using population also skews slightly Hispanic when compared with other adult cell phone users.
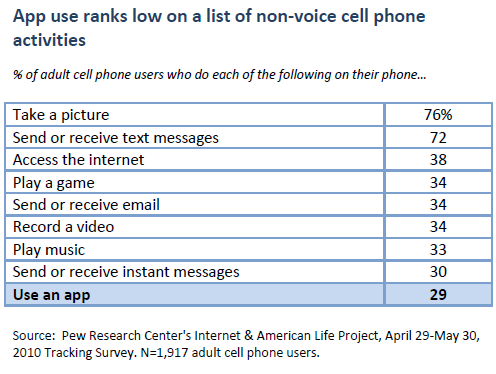
App use still ranks relatively low when compared with other uses of cell phones
While 24% of adults, 29% of adults with cell phones, use applications on their phones, apps use still ranks relatively low when compared with other non-voice cell phone activities. Taking pictures and texting are far and away the most popular non-voice cell phone data applications, with more than seven in ten adult cell phone users embracing these features of their phones.
29% of adult cell phone users have downloaded an app to their phone
As with the apps-using population as a whole, downloaders are younger, more educated, and disproportionately male when compared with the total U.S. adult population. And while they resemble adults who only have preloaded apps in terms of education, they are still disproportionately young and male even when compared with this group.
One in ten adult cell phone users (10%) had downloaded an app in the past week; 20% of cell phone users under age 30 download apps this frequently
Those who download apps do so fairly frequently. Among apps downloaders, roughly half (53%) say their most recent download was in the past 30 days, including one third (33%) who say their last download was within the past week. As a fraction of all cell phone-using adults, that equates to 15% who have downloaded apps in the past month, and 10% who have downloaded apps in the past week. Among cell phone users under age 30, 20% have downloaded an app in the past week.
One in eight adult cell phone users (13%) has paid to download an app
Among the 29% of adult cell phone users who download apps, just under half (47%) have paid for an app, with the remainder saying they only download apps that are free. Put in broader context, that means that 13% of all adult cell phone users have paid to download an app to their phone. There are few notable demographic differences between downloaders who pay for apps and those who do not.
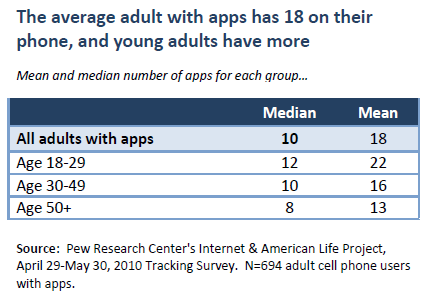
Among cell phone users with apps, the average adult has 18 apps on his or her phone
Among adult cell phone users who have software applications on their cell phones, the mean number of apps is 18. However, the median number of apps is 10, indicating there are heavy apps users on the high end of the response scale who have a disproportionate number of apps on their phones. This is particularly true among the youngest adults.
Again, there is some uncertainty among cell phone users, particularly older cell phone users, about what software they have on their phones. Fully 18% of cell phone users with apps on their phones do not know how many they have. That figure doubles to 36% among cell phone users age 50 and older.
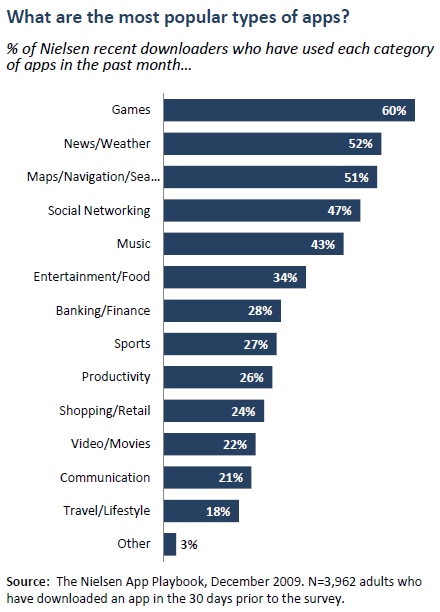
Findings from the Nielsen Apps Playbook Survey
Nielsen data indicate that games are the most popular apps, followed by news/weather, maps/navigation, social networking, and music.
In addition to drawing on results from the Pew Internet Project’s own nationwide probability sample of 2,252 adults, this report also presents findings from The Nielsen Company’s Apps Playbook, a December 2009 survey of a nonprobability sample of 3,962 adult cell phone subscribers who had downloaded an app in the previous 30 days.1 Although the Nielsen survey cannot be projected to the population of all app downloaders with a known degree of accuracy, it provides an extensive snapshot of the types of apps people are downloading and a broad sense of how they are using them.
Among the recent downloaders Nielsen surveyed, game apps were the most downloaded apps overall in terms of both volume and the percent of adults who had downloaded them.2 In terms of actual apps use, six in ten of Nielsen’s recent downloaders (60%) said they had used a game app in the past 30 days, and roughly half said they had used a news/weather app (52%), a map/navigation app (51%), or a social networking app (47%) in that same timeframe. While music apps ranked second on the most downloaded list, they ranked fifth on the most used list.
In the Nielsen survey, most recent apps downloaders said they used their apps daily but for short periods of time, and used them in a variety of situations
Some 57% of the recent apps downloaders in the Nielsen study said they use their apps daily. While one quarter of these recent apps downloaders (24%) said they use their apps for more than 30 minutes a day, the vast majority said they spend less time using their apps each day.
Asked where they use their apps most frequently, 71% of the Nielsen sample said they frequently used their apps when they were alone, and about half said they frequently used their apps while waiting for someone or something (53%) or while at work (47%). One in three (36%) said they frequently used apps while commuting.
The Nielsen survey indicates that different people may use apps in different ways
There were several notable differences among the Nielsen recent-downloader sample in terms of which apps they favored and how frequently they used them. For instance:
- Women in the sample were more likely than men to have used a social networking app in the past 30 days (53% v. 42%), and women who used the Facebook app were also more likely to use that app everyday (64% v. 55%)
- Women in the sample were more likely than men to have a used a game app in the past 30 days (63% v. 58%), while men were more likely to have used a productivity app (29% v. 21%) or a banking/finance app (31% v. 25%)
- Among the Nielsen sample of recent downloaders, whites (53%) and Hispanics (47%) were more likely than African-Americans (36%) to have used a map/navigation/search app in the month prior to the survey
- Hispanics, on the other hand, were the most likely to have used a music app recently (48% of Hispanics v. 42% of whites and 42% of African-Americans)
- In the Nielsen sample, 75% of 18-24 year-old Twitter app users reported using that app every day, compared with 52% of the 25-34 year-olds and 48% of the Twitter users age 35 and older
- In contrast, among Nielsen’s Facebook app users, 25-34 year-olds were more likely than both younger and older Facebook app users to report using their Facebook app daily
- The African-Americans and Hispanics in the Nielsen sample were significantly more likely than whites to be daily users of their Youtube apps (33% of African-Americans v. 24% of Hispanics v. 12% of whites) and their Pandora music apps (33% of African-Americans v. 27% of Hispanics v. 14% of whites)
The Nielsen study indicates that cell phone screen real estate is valuable
Slight majorities of Nielsen’s recent app downloaders said they organize their apps so that the most frequently used are easily accessible (59%), and that they delete apps from their phones that are not useful or helpful (56%). And this culling process happens relatively quickly; among those who had deleted an app, 62% said they usually do it within two weeks of downloading the software. The men in the Nielsen sample deleted apps more quickly than women; 40% of the male recent-downloaders said they delete apps they did not find useful within a week, compared with 29% of the women.
About Pew Internet Project Findings
The figures from the Pew Internet Project survey were gathered in a telephone survey of a representative sample of 2,252 U.S. adults age 18 and older between April 29 and May 30, 2010. The sample included 1,917 adult cell phone users, 744 of whom were contacted on their cell phones. The margin of error is +/- 2.4 percentage points for results based on the total sample of adults, and +/- 2.7 for results based on cell phone users.
The Nielsen data are from an online, self-administered survey with a nonprobability sample of 4,265 recent apps downloaders originally identified in Nielsen’s Mobile Insights survey of cell phone subscribers. Because the survey is not based on a probability sample, no margin of error can be computed and the results cannot be generalized to the population of recent app downloaders with a known degree of precision. The Mobile Insights sample is drawn from a combination of online panels and is augmented by a Spanish language phone survey in highly concentrated Hispanic markets using a residential phone list sample frame for improved coverage of Hispanics. The Apps Playbook follow-up survey was conducted in December of 2009, and screened for “recent downloaders”—those who had downloaded an app in the past 30 days. The Apps Playbook data includes teen as well as adult cell phone subscribers, but for this report, percentages are based only on the 3,962 adults ages 18 and older who had downloaded an app in the past 30 days.
A new “apps culture”
Cell phones now permeate American culture. As they become more powerful as connected, multi-media, handheld devices, a new ecosystem of computing applications is being created around them. The emergence of this pervasive mobile connectivity is changing the way people interact, share creations, and exploit the vast libraries of material that are generated for the internet.
The newest national phone survey of the Pew Research Center’s Internet & American Life Project shows that 82% of adults are cell phone users, and about one-quarter of adults (23%) now live in cell phone only households – that is, households with no landline phone. According to Pew Internet survey data, as of September 2009, three-quarters of 12-17 year-olds had cell phones, and a 2010 Kaiser Family Foundation study indicated almost a third of 8 to 10 year-olds in the U.S. have cell phones today.3
The widespread embrace of mobile technology has spawned the development of an “apps culture.” As the mobile phone has morphed from a voice device to a multi-channel device to an internet-accessing mini-computer, a large market of mobile software applications designed specifically for cell phones has developed alongside it.
Currently, the cell phone industry lacks a standard, widely shared definition of what is and is not considered an “app.” Traditionally the term “app” has been used as shorthand for any software application. With the advent of the mobile phone, the term “app” has become popular parlance for software applications designed to run on mobile phone operating systems. For the purpose of this report, apps are defined as end-user software applications that are designed for a cell phone operating system and which extend the phone’s capabilities by enabling users to perform particular tasks. Assuming this definition, cell phone apps as discussed here are distinct from cell phone functions, which are hardware-enabled activities such as taking pictures and recording video and/or which run on systems software. Cell phone apps as defined here rely on or require certain systems software and/or hardware features to function, and may be thought of as being layered on top of them.
To understand whether and how U.S. adults have jumped into the emerging apps market, and how apps use compares to the use of other cell phone features, the Pew Internet Project recently conducted a national survey of adults age 18 and older that included 1,917 cell phone users.
Broadly, results indicate that while apps are popular among a young, tech-hungry segment of the adult cell phone using population, a notable number of adult cell phone users are not part of apps culture. Many adults who have apps on their phones, particularly older adults, do not use them, and one in ten adults with a cell phone (11%) are not even sure if their phone is equipped with apps. Moreover, apps use ranks fairly low when compared with the use of other cell phone functions such as taking pictures and texting.4
35% of adults have cell phones with apps
Of the 82% of adults today who are cell phone users, 43% have apps on their phones. When taken as a portion of the entire U.S. adult population, that means that 35% have cell phones with apps. This figure includes adult cell phone users who:
- have downloaded an app to their phone (29% of adult cell phone users), and/or
- have purchased a phone with preloaded apps (38% of adult cell phone users)
A “yes” answer to either question was sufficient to include someone in the apps population. Of course, many cell owners (23%) have both pre-loaded and downloaded apps on their cell phones.
One in ten adult cell phone users do not know if they have apps on their phone
While 38% of adults cell phone users report having a phone that came preloaded with apps, another 11% of cell phone users said they did not know if their phone came with any software applications. This uncertainty about cell phone features is most pronounced among cell phone users age 50 and older, 15% of whom did not know if their phone came with apps. Just 4% of cell phone users under age 30 could not say if their phone came with software applications.
Adult cell phone users are more confident when asked whether they have ever downloaded an app, with 29% saying yes, 70% saying no, and less than one half of one percent saying they did not know.
Two-thirds of adult cell phone users who have apps actually use them
While 35% of adults have apps on their phones, only about two-thirds (68%) of adults who have apps report actually using them. That means that 24% of all adults in the U.S. use apps.
Among those who actively use their apps, the vast majority (91%) have used them within the past 30 days. Just 9% of apps users say it has been more than 30 days since the last time they used the apps on their phone.
Apps users are younger, more educated, and more affluent than other cell phone users
Apps users have a distinct demographic profile when compared with other cell phone using adults, and when compared with the entire U.S. adult population. Apps users skew male, and they are much younger than the broader population. Overall, they are also more educated and more affluent than other cell phone users or the adult population as a whole. The apps-using population also skews slightly Hispanic when compared with other cell phone users and all adults.
Among adults who have apps, age is the strongest predictor of apps use
It is clear that young adult cell phone users are the most eager apps adopters. While 79% of 18-29 year-olds who have apps on their phones say they use them, that figure drops to 67% among 30-49 year-olds and just 50% among adults age 50 and older.
Cell phone only adults (those who have a cell phone but no landline phone) are also especially likely to use the apps on their phone. Some 75% of this group who have apps say they use them. This may be due in part to a disproportionate number of cell only adults relying on their phones for internet access and participation in online activities.5
It is not surprising that adults who are heavy cell users in general (heavy texters and heavy voice users) are much more likely than other adults to use their apps and to have used them in the past 30 days. The relationship between apps use and the use of other cell phone features/technologies is discussed in detail in Part III of this report.
Overall, adults who have more apps on their phone, those who have downloaded apps (as opposed to purchasing a phone that is preloaded with apps), those who have downloaded an app recently (within the past 30 days), and those who have paid for an app download are significantly more likely than other adults to actually use the software on their phones.
Among those who have apps, the average number of apps is fairly high at 18
Among adult cell phone users who have software applications on their cell phones, the mean number of apps is 18. However, the median number of apps is 10, indicating there are heavy apps users on the high end of the response scale who have a disproportionate number of apps on their phones. This is particularly true among the youngest adults.
Again, there is some uncertainty among cell phone users, particularly older cell phone users, about what software they have on their phones. Fully 18% of cell phone users with apps on their phones do not know how many they have. That figure doubles to 36% among cell phone users age 50 and older.
Looking just at those who know how many apps they have, young adult cell phone users on average have a greater number of apps on their phones. The mean number of apps for 18-29 year-olds is 22, compared with a mean of 16 for 30-49 year-olds, and 13 for adult cell phone users age 50 and older. However, the medians show considerably less variation, with young adults having a median of 12 apps on their phone and those over age 50 having a median of 8.
Apps use ranks relatively low when compared with other cell phone activities
While 24% of adults, or 29% of adult cell phone users, report using apps on their phones, apps use is not the most popular feature of cell phones when compared with other non-voice cell phone activities. Taking pictures and texting are far and away the most popular cell phone activities, with apps use ranking lowest among the various activities Pew Internet has asked about.
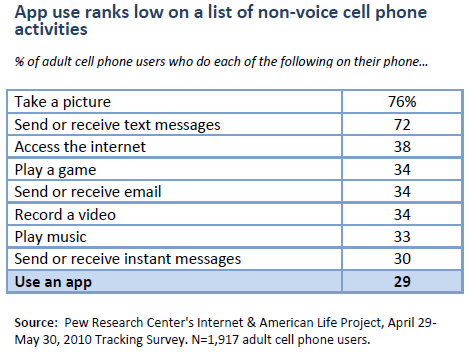
These data may reveal again, however, some uncertainty among adult cell phone users about when they are, and are not, using apps. Many of the activities in the above table, such as playing a game and sending and receiving email, often make use of software applications, and therefore constitute apps use. Thus, one would expect the percent who say they use apps to be higher. Yet, apps use garners a slightly lower percentage of “yes” responses from cell phone users than do other app-enabled activities.
One might infer from these figures that adults are not always aware when engaging in various activities using their phones that they are, in fact, using an app or software application. This may be due, in part, to confusion among the public over whether the different software that comes preloaded on their phone are “apps,” or whether an app is something that must be purchased separately or downloaded from the internet.


