Apps and app users
As part of its ongoing research into telecom trends, the Nielsen Company conducts a quarterly tracking survey of more than 80,000 mobile subscribers age 13 and older sampled from a combination of online panels and augmented with listed Hispanic telephone sample. Among other measures, the Mobile Insights survey identifies mobile subscribers who have downloaded an app to their phone. In the fourth quarter of 2009, Nielsen found that 13% of their adult (age 18 and older) mobile subscribers had downloaded an app in the past 30 days. As noted earlier, the current Pew Internet survey finds that as of April 2010, 15% of cell-phone using U.S. adults age 18 and older had downloaded an app to their phone in the past 30 days.
In December 2009, Nielsen completed online, self-administered surveys with 4,265 apps downloaders originally identified in the Mobile Insights survey. This follow-up survey (The Nielsen Apps Playbook) asked “recent downloaders”—those who had downloaded apps in the past 30 days—more detailed questions about the types of apps they download, in what contexts they use their apps, and whether and how much they pay for apps. The results reported here are based on the 3,962 adults ages 18 and older in the Nielsen sample who had downloaded an app in the past 30 days.
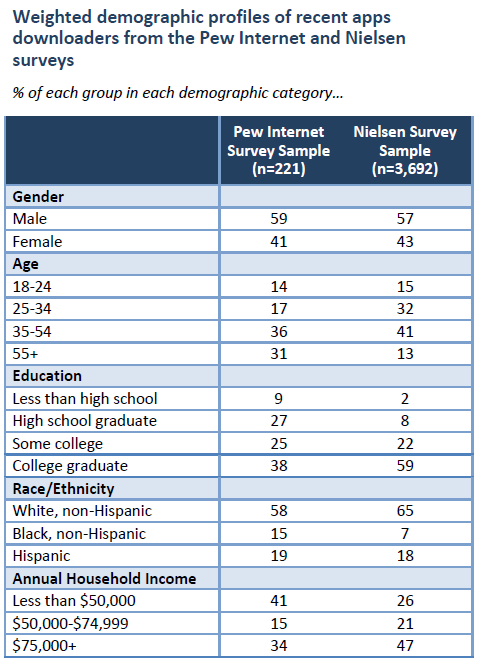
It should be noted that because Nielsen’s Mobile Insights survey is administered to a nonprobabilty sample, it is not representative of all recent apps downloaders and the findings reported here should be considered descriptive. However, the Nielsen data produce overall estimates of adult apps downloading rates comparable to the most recent Pew Internet survey. As the table below indicates, after weighting, the two samples are similar in terms of sex and race/ethnicity, though the Nielsen sample is skewed slightly toward white non-Hispanics and away from African-Americans. The two samples diverge more notably on education and income, with the Nielsen sample overrepresenting college graduates and the highest income categories. In terms of age, the Pew probability sample produces a recent-downloader population that is slightly older than the Nielsen sample.
Adult apps users are hooked on games
As indicated by the Pew Internet survey data, apps downloading and apps use are not synonymous. Some adults may download apps that they do not actually use. Thus, the Nielsen App Playbook asks about both recent downloading behavior, as well as which apps recent-downloaders have used in the past 30 days, how frequently they use them, and in what contexts.
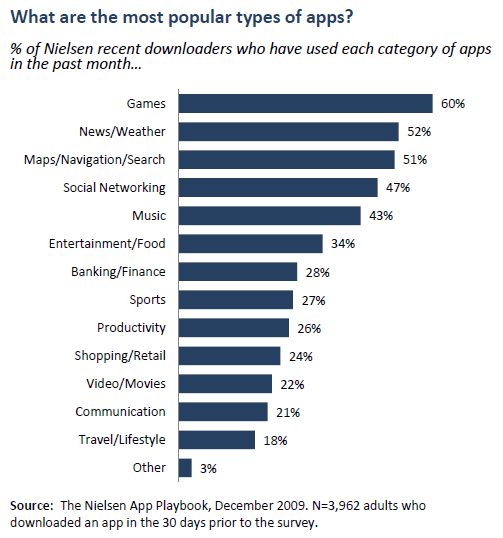
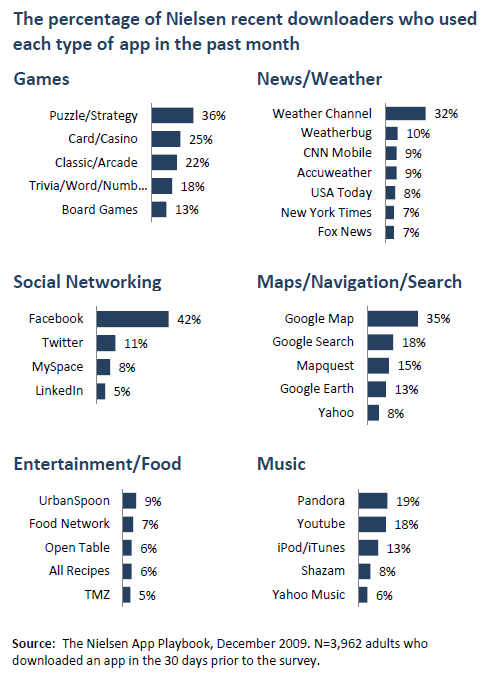
As the table below indicates, the adult downloaders in the Nielsen sample are hooked on games. Six in ten of these recent downloaders said that they had used a game app in the past 30 days. By comparison, roughly half said they had used a news/weather app, map/navigation app, or social networking app in that same timeframe. While music apps ranked second in terms of total downloads, they ranked fifth on the most used list for this group.
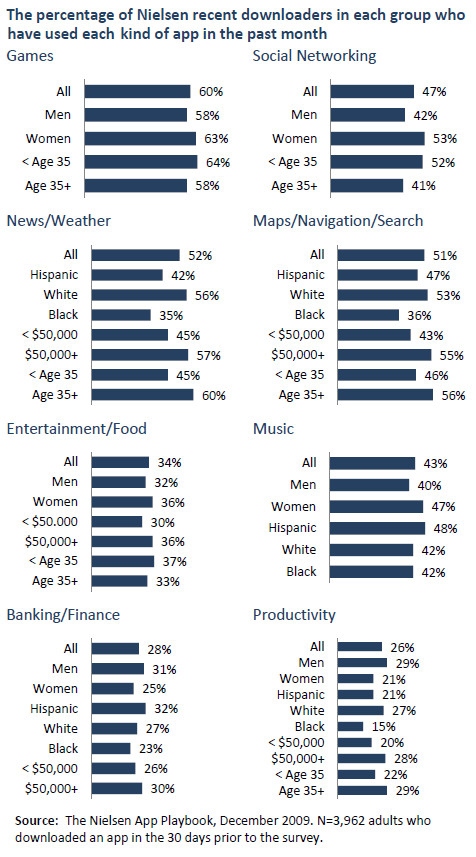
In the Nielsen sample, some demographic groups were more likely than others to use particular categories of apps. For instance, men in that sample were more likely than women to have used banking/finance, sports, productivity, and video/movie apps in the past 30 days. Women recent-downloaders in the sample, on the other hand, were more likely to have used games, social networking, music, and entertainment/food apps.
The tables below show rates of use for the major categories of apps across demographic groups.
Within the different categories of software applications, some apps stood out as particularly popular among the Nielsen sample. Asked which specific apps they had used in the past 30 days, puzzle/strategy games ranked highest in the games category, while the Weather Channel was far and away the most used news/weather app for this group. Google applications comprised three of the top four map/navigation/search apps, while Facebook topped the list of social networking apps used by Nielsen’s adult downloaders.
Frequency of Apps Use
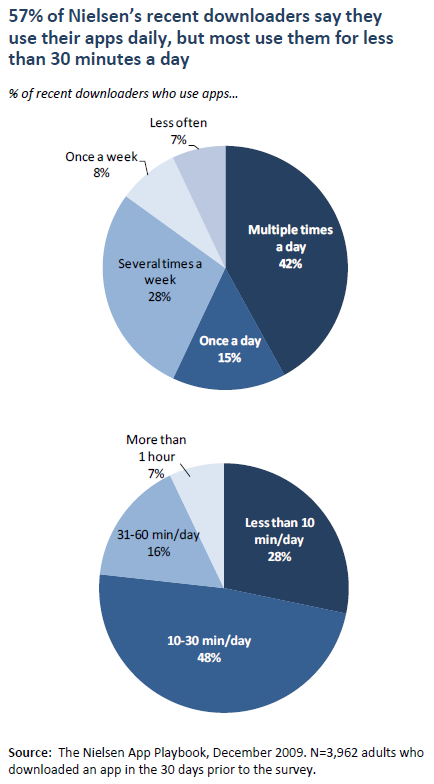
More than half of the Nielsen recent apps downloaders (57%) reported using their apps daily, yet the vast majority said they spend less than 30 minutes per day using their apps. Just one quarter of Nielsen’s downloaders (23%) said they use their apps for at least a half an hour a day.
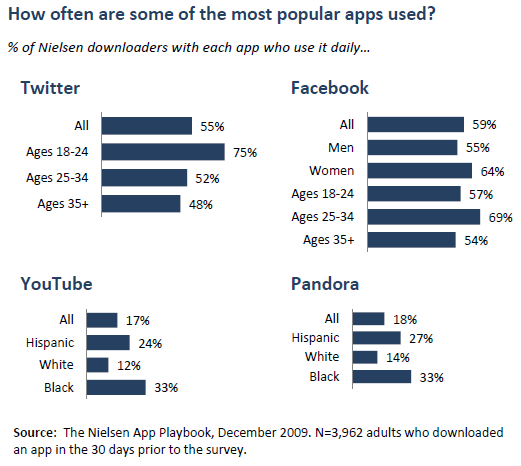
Somewhat surprising is the fact that the youngest apps downloaders in the Nielsen sample, those age 18-24, were not the most frequent apps users. While 29% of this age group said they use their apps multiple times a day, the same was true of 44% of the 25-34 year-olds and 44% of those age 35 and older. Nielsen’s young apps users were also more likely than their older counterparts to say they use their apps for less than 30 minutes per day (84% of the 18-24 year-olds v. 74% of the 25-34 year-olds v. 75% of those age 35 and older).
Among Nielsen’s sample of downloaders, the frequency of apps use varied by race as well, with the white and Hispanic downloaders more likely than the African-Americans to use their apps daily (57% whites v. 54% Hispanics v. 48% African-Americans). However, Nielsen’s white apps downloaders were also the most likely to say that they use their apps for less than 10 minutes a day (30% whites v. 25% Hispanics v. 23% African-Americans).
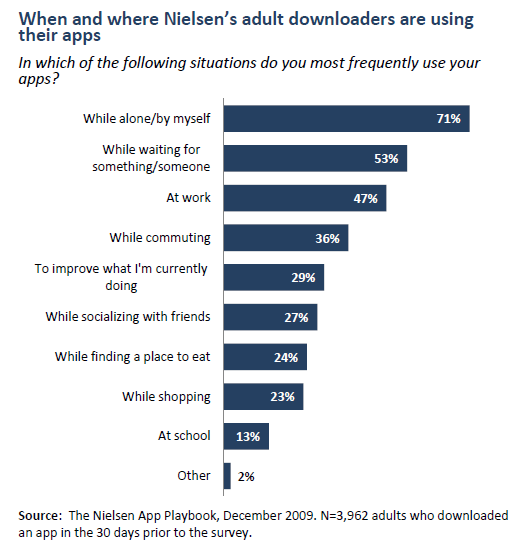
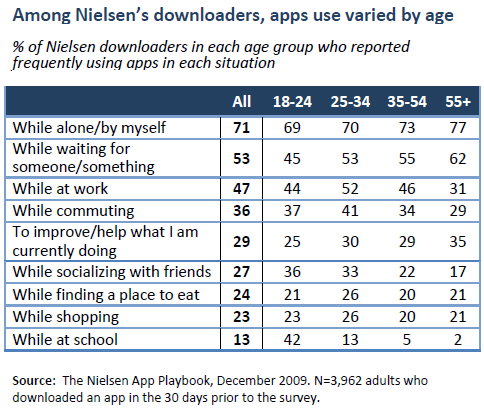
Adult downloaders in the Nielsen sample reported using their apps in a variety of contexts. Asked in which situations they most frequently use their apps, seven in ten (71%) said they frequently use their apps when they are alone, and about half said they frequently use their apps while they are waiting for someone or something (53%) or while at work (47%). Roughly one in three Nielsen downloaders (36%) said they frequently use their apps while commuting. Overall, the adults in the Nielsen sample reported using their apps for a mix of entertainment and instrumental purposes.
In the Nielsen sample, men were more likely to report using apps at work (52% v. 40% of women), while women were slightly more likely to report using apps while alone (73% v. 70% of men) and while waiting for someone (59% v. 52%). Nielsen’s Hispanic and African-American downloaders were more likely than the whites in the sample to report using their apps at school (17% Hispanics v. 17% African-Americans v. 6% whites) and while socializing with friends (33% Hispanics v. 33% African-Americans v. 22% whites). The Hispanics in the sample were also more likely than whites to report using their apps while commuting, while finding a place to eat, and while shopping.
The Nielsen sample also produced some interesting situational use differences across age groups. The table below shows that young adult apps users in the Nielsen sample (those age 18-24) were the most likely to report using their apps while socializing with friends, while Nielsen’s middle-age users were the most likely to report using their apps while at work, commuting, shopping or finding a place to eat. App users age 55 and older in the Nielsen sample were the most likely to report using their apps while alone, while waiting for someone/something, and to help in an activity they are currently doing.
What kinds of apps are being downloaded most often by this group?
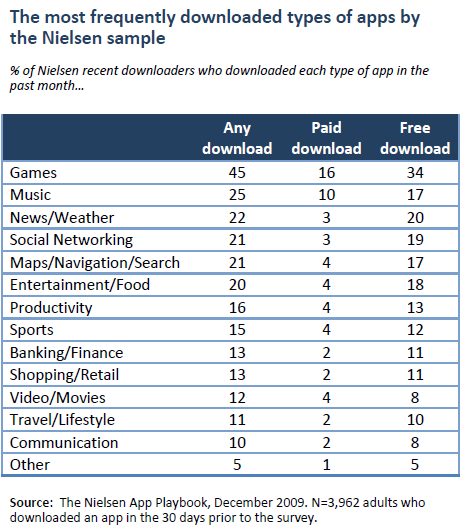
Among Nielsen’s recent adult downloaders, game apps were the most downloaded apps overall in terms of sheer volume, followed distantly by music and entertainment/food. Overall, apps that are used for personal entertainment made up a greater portion of this group’s recent downloads than those that are used for instrumental purposes, such as productivity, navigation, and finance apps.
For the Nielsen sample, games and music were the most popular in terms of the percent of downloaders who have downloaded each type in the past 30 days. Games were far and away the most popular, with almost half of Nielsen’s recent-downloaders saying they had downloaded at least one paid or free game app in the previous month. Roughly equal percentages of Nielsen recent-downloaders (about one in five) said they had downloaded a music app, a news/weather app, a social networking app, a map/navigation app, or a food/entertainment app in the 30 days prior to the survey.
Games and music were also the most commonly downloaded paid apps for this group, as measured by the percent of Nielsen recent-downloaders who had purchased at least one of these types of apps in the past month.
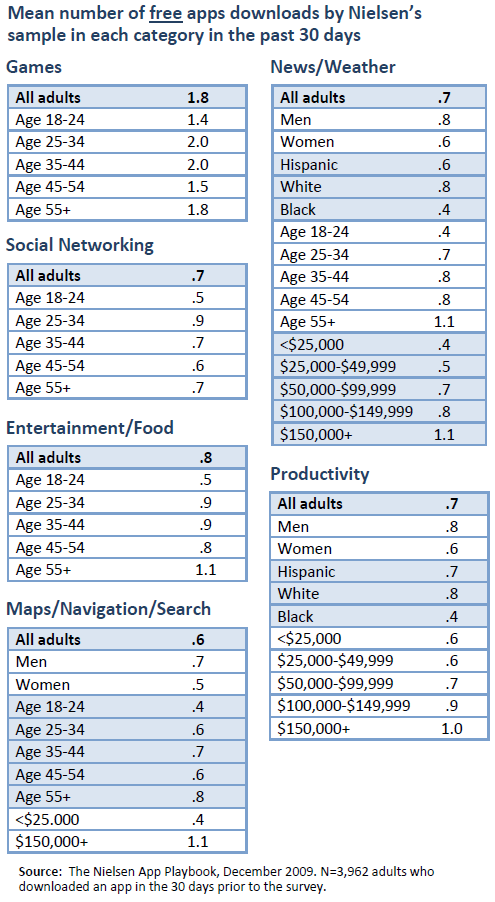
The Nielsen sample produced some interesting downloading differences across age group, race/ethnic groups, and income categories, yet these differences only occurred in the case of free downloads. For instance, Nielsen downloaders between the ages of 25 and 44 had a higher mean number of free game downloads in the past 30 days (2.0) than both the younger (1.4) and the older (1.7) adults in the sample. Similarly, downloaders ages 25-34 in the Nielsen sample had the highest mean number of free social networking apps downloads in the month prior to the survey (.9 for the 25-34 year-olds v. .5 for the younger adults and .7 for the older adults).
The tables below show some demographic differences that emerged in the Nielsen sample in the mean number of free downloads for major categories of apps.
Consistent with the Pew Internet survey data, the Nielsen sample produced few notable demographic differences between recent-downloaders who have paid to download an app and those who have not. Nielsen’s youngest apps downloaders, those age 18-24, and adults with incomes below $50,000 were only slightly less likely than the older and more affluent downloaders in the sample to have paid for apps.
What do Nielsen’s downloaders report paying for apps?
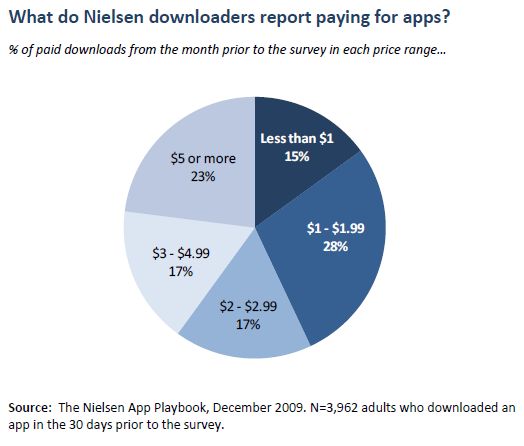
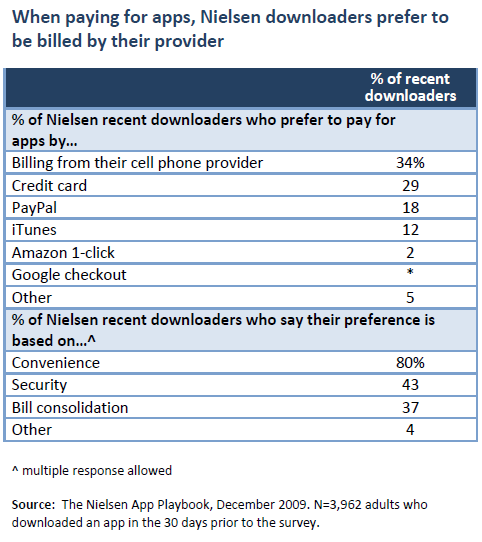
In the Nielsen Apps Playbook, 37% of the recent-downloaders said they had paid for an app in the past 30 days. As noted earlier, games accounted for the highest percentage of paid apps by this group, followed by music apps. Asked if they had ever converted from a free/lite trial version to a full paid version of an app, one in three (33%) Nielsen downloaders said they had done so.
To determine what the recent-downloaders are paying for apps, the Apps Playbook asked respondents how many of the total apps they had downloaded in the past 30 days fell into each of eight different price categories. Responses indicate that among this sample of downloaders, most paid downloads were between $0 and $2.99. Fully 60% of paid downloads from the month prior to the survey fell in this price range.
When they did pay for an app, about a third (34%) of the downloaders in the Nielsen sample said their preference was to have it billed directly by their cell phone provider, while just under a third (29%) said they preferred to put it on a credit card. Asked what factors drive those preferences, eight in ten Nielsen downloaders (80%) said that convenience was a factor, while roughly six in ten said they take into account bill consolidation (63%) and security (57%).
Where do downloaders say they learn about apps?
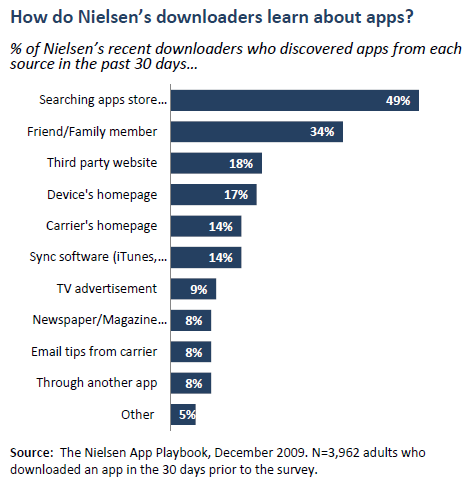
Asked how they discover the apps they download, the two most common responses from downloaders in the Nielsen sample were searching an apps store on their phone and relying on recommendations from friends and family. About half (49%) of this group said they discover apps by browsing an apps store on their phones, and about one in three (34%) said they hear about them from friends and family.
The women in the sample were slightly more likely than the men to say they learn about apps from friends and family (39% v. 33%), while the men were twice as likely to say they learn about apps from third party websites (25% v. 12%). Nielsen’s older apps downloaders, those age 55+, were also particularly likely to say they hear about apps from friends and family (42% v. 34%), and were twice as likely as the younger apps downloaders in the sample to discover apps through newspapers, magazines and radio (15% v. 7%).
In the Nielsen sample, apps downloaders in the highest income categories, those earning $100,000 or more annually, were particularly likely to say they discover apps by searching the apps store on their phones and through sync software, while those in the lower income categories were more likely to say they hear about apps through their carrier’s homepage.
The African-American and Hispanic downloaders in the sample were also particularly likely to say they find apps through their carrier’s homepage (25% African-American v. 18% Hispanic v. 12% white) and their device homepage (24% African-American v. 19% Hispanic v. 15% white).
Nielsen’s downloaders reported not only relying on the recommendations of friends and family in downloading apps, but also relying on the recommendations of strangers. The Nielsen App Playbook asked recent-downloaders how important user reviews and ratings are in their decision to download an app. Almost nine in ten downloaders in this survey (88%) said that user reviews are at least somewhat important, including 19% who said they are extremely important.

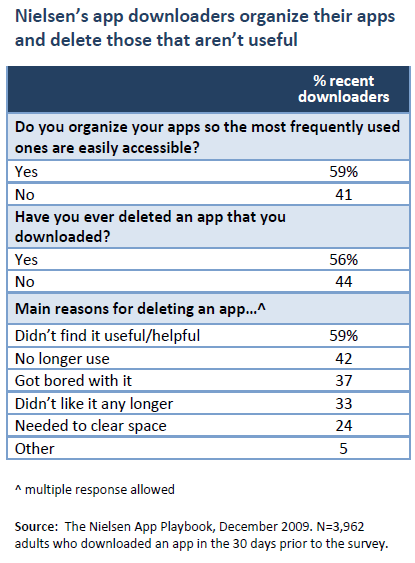
Cell phone real estate is valuable
Most apps users in the Nielsen sample report organizing their apps so that the most frequently used are most easily accessible. They also report deleting apps from their phones. The most common reasons given by this group for deleting an app is that it is not useful. And they report that this culling process happens relatively quickly; among those who had deleted an app, the majority (62%) said they usually did it within two weeks of downloading the software. The men in the sample tended to delete apps they did not find useful more quickly than the women did; 40% of the male recent-downloaders said they deleted apps they do not like within a week of getting them, while only 29% of the women said they delete apps that quickly.