
Pew Internet Project Survey
This report is based on the findings of a daily tracking survey on Americans’ use of the Internet. The results in this report are based on data from telephone interviews conducted by Princeton Survey Research Associates International between April 29 and May 30, 2010, among a sample of 2,252 adults, age 18 and older. Interviews were conducted in English. For results based on the total sample, one can say with 95% confidence that the error attributable to sampling and other random effects is plus or minus 2.4 percentage points. For results based on cell phone users (n=1,917), the margin of sampling error is plus or minus 2.7 percentage points. In addition to sampling error, question wording and practical difficulties in conducting telephone surveys may introduce some error or bias into the findings of opinion polls.
A combination of landline and cellular random digit dial (RDD) samples was used to represent all adults in the continental United States who have access to either a landline or cellular telephone. Both samples were provided by Survey Sampling International, LLC (SSI) according to PSRAI specifications. Numbers for the landline sample were selected with probabilities in proportion to their share of listed telephone households from active blocks (area code + exchange + two-digit block number) that contained three or more residential directory listings. The cellular sample was not list-assisted, but was drawn through a systematic sampling from dedicated wireless 100-blocks and shared service 100-blocks with no directory-listed landline numbers.
New sample was released daily and was kept in the field for at least five days. The sample was released in replicates, which are representative subsamples of the larger population. This ensures that complete call procedures were followed for the entire sample. At least 7 attempts were made to complete an interview at a sampled telephone number. The calls were staggered over times of day and days of the week to maximize the chances of making contact with a potential respondent. Each number received at least one daytime call in an attempt to find someone available. For the landline sample, half of the time interviewers first asked to speak with the youngest adult male currently at home. If no male was at home at the time of the call, interviewers asked to speak with the youngest adult female. For the other half of the contacts interviewers first asked to speak with the youngest adult female currently at home. If no female was available, interviewers asked to speak with the youngest adult male at home. For the cellular sample, interviews were conducted with the person who answered the phone. Interviewers verified that the person was an adult and in a safe place before administering the survey. Cellular sample respondents were offered a post-paid cash incentive for their participation. All interviews completed on any given day were considered to be the final sample for that day.
Non-response in telephone interviews produces some known biases in survey-derived estimates because participation tends to vary for different subgroups of the population, and these subgroups are likely to vary also on questions of substantive interest. In order to compensate for these known biases, the sample data are weighted in analysis. The demographic weighting parameters are derived from a special analysis of the most recently available Census Bureau’s March 2009 Annual Social and Economic Supplement. This analysis produces population parameters for the demographic characteristics of adults age 18 or older. These parameters are then compared with the sample characteristics to construct sample weights. The weights are derived using an iterative technique that simultaneously balances the distribution of all weighting parameters.
Following is the full disposition of all sampled telephone numbers:
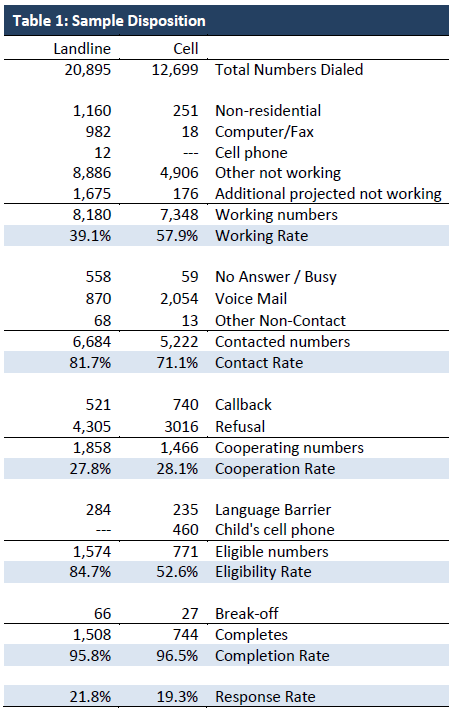
The disposition reports all of the sampled telephone numbers ever dialed from the original telephone number samples. The response rate estimates the fraction of all eligible respondents in the sample that were ultimately interviewed. At PSRAI it is calculated by taking the product of three component rates:
- Contact rate – the proportion of working numbers where a request for interview was made
- Cooperation rate – the proportion of contacted numbers where a consent for interview was at least initially obtained, versus those refused
- Completion rate – the proportion of initially cooperating and eligible interviews that were completed
Thus the response rate for the landline sample was 21.8 percent. The response rate for the cellular sample was 19.3 percent.
The Nielsen Apps Playbook
The Nielsen Company conducts a quarterly attitude and behavior survey of more than 80,000 mobile subscribers in the U.S. ages 13 and older. The Mobile Insights survey covers multiple research topics, measuring the attitudes and behaviors of both wireless subscribers and non-subscribers, and including questions about:
- Subscriber Usage
- Brand Awareness
- Customer Satisfaction
- Network Performance Perceptions
- Switching Behavior
Mobile Insights surveys over 25,000 panelists every month—over 300,000 consumers a year. The Mobile Insights survey is fielded during the first half of each month. The Mobile Insights panel includes a subset of 2,500 Hispanic panelists every month—over 30,000 Hispanic consumers a year. Within this Hispanic panel subset, each month at least 1,000 respondents complete an online survey and 1,500 complete a phone survey.
Because the survey is not based on a probability sample, no margin of error can be computed and the results cannot be generalized to the population of recent app downloaders with a known degree of precision.
Sampling
Survey respondents are selected at random within Consolidated Metropolitan Statistical Areas/Metropolitan Statistical Areas (CSMA/MSA) markets from the panel rolls of five or more different online panel source companies in order to attain a diverse sample of persons age 13 and older in the US. The Mobile Insights survey sample is selected from internet sample frames constructed and maintained for general population surveys by such companies as Harris Interactive, Market Tools, Survey Sampling International, e-Rewards and Lightspeed Research. The Hispanic portion of the online sample described above is augmented by a Spanish language phone survey in highly concentrated Hispanic markets using a residential phone list sample frame for improved coverage of unacculturated Hispanics.
Each month, a sample of web-enabled online panelists is sent invitations to participate in the Mobile Insights survey via email. The study is described to survey participants as one about “cell phones” and respondents are asked to share their opinions “regardless of whether you use a cell phone.” In the survey email invitation, potential participants are directed to the Mobile Insights survey website.
Initial double and/or triple opt-in recruiting practices by the sample providing companies are conducted through a wide variety of sources including: opt-in recruiting during online personalization registration, banner and/or text advertising on selected websites, follow-on recruiting for panelists at the end of ad-hoc surveying and direct mail recruiting through opt-in electronic mail accounts.
In order to maintain reliability and integrity in the sample, the following procedures are used:
- Unique URL protection: Each invitation contains a unique website address assigned to the targeted email address. This unique address allows for only the invited participant to access the survey website and the survey can be completed only once with a single credential.
- Only cell phone users can respond to user questions: Only primary users of mobile technology are designated to complete the specific usage, consumption and attitudinal sections of the survey. As a precaution, each respondent is re-qualified as a mobile user. Only primary cell phone users are responsible for providing data about their personal and business usage of mobile services.
- Second invitations: In order to maximize the survey sample, second follow-up email invitations are mailed to all nonresponding invitees, reminding them of the opportunity to participate in the survey.
The supplemental Spanish language sample is recruited using random digit dialing (RDD) in Puerto Rico. In the continental US, sample is recruited from a listed household sample frame that has been filtered using a Hispanic surname database derived from the US Census Bureau. This Hispanic surname database of listed households is the criterion for the random selection of records across phone directories in 30 residential ZIP code areas that are known to have a high density Hispanic population.
Sample design
The adult (over age 18) Mobile Insights sample is stratified by metropolitan area including 102 markets and the remaining “white space” (non-metropolitan areas). Systematic (unduplicated random) sampling is conducted within each metropolitan area and white space. Outcomes are weighted according to market-specific demographic targets as estimated by the US Census Bureau and Nielsen Mobile market share benchmarks.
The top ten metropolitan areas are targeted for 1,250 respondents per quarter; the next 25 markets are targeted for 1,000. Other markets have quotas of 125 to 500 respondents, depending on the size of the market. 8,000 respondents are targeted in the remaining US white space.
A subsample of teens age 13–17 is also included in the monthly Mobile Insights survey. 3,500 teens are sampled separately and have quota sample requirements by age bracket as well as by region. This teen sample is weighted separately from adult sample, so teens can be analyzed separately or together with the adult population.
The supplemental telephone survey of the adult Hispanic population is conducted with participants who speak at least some Spanish in the home. Telephone interviewing (computer assisted) is conducted using telephone lists in 7 primary and 20 secondary metropolitan areas in the US that are identified as counties with Hispanic/Latino population densities of 50% or higher; the survey is also conducted in Puerto Rico. Phone surveys are targeted for 4,500 respondents per quarter. These phone survey respondents are merged with Hispanics from the online national survey, and weighting is done to US Census Bureau benchmarks for the combined sample, adjusting for penetration of acculturated and unacculturated Hispanic levels. The supplemental Hispanic sample is combined with all adults in monthly market level weighting.
Qualification
Mobile Insights qualified completes are defined as those online panelists that complete the survey; this group includes both mobile subscribers and non-subscribers.
Mobile Insights mobile subscriber qualified completes are defined as those panelists who answer positively to the screening question: “Do you currently use or subscribe to a cell phone service (e.g., monthly or prepaid service), regardless of who pays for it?”
Panelists are further categorized in terms of cell phone use according to their positive response to one of the following:
- I have my own cell phone
- I share a cell phone with someone else, but I am the primary user
- I share a cell phone with someone else, and I am not the primary user
- I do not use a cell phone
Nielsen Mobile includes various qualification questions in the Mobile Insights survey that route subscribers to additional usage-based survey questions. These usage-based screening questions also qualify the respondent to be invited to participate in a re-contact survey based on targeted topical subject areas, such as mobile media. In addition, a random sample of qualified completes are invited to participate in Nielsen Mobile’s Bill Panel.
Questionnaire design
All online interviews are conducted using a self-administered, online questionnaire via web-assisted interviewing software. The survey interviewing system permits online data entry by the respondents. Questionnaires are programmed into the system with the following checks:
- Question and response series
- Skip patterns
- Special edit procedures
- Mathematical checks
- Question rotation
- Consistency checks
- Range checks
For questions with precoded responses, the system permits only answers within a specified range; for example, if a question has three possible answer choices (e.g., “Agree,” “Disagree,” or “Not sure”), the system accepts only coded responses corresponding to these choices. All data are tabulated, checked for internal consistency, and systematically processed by computer. A series of computer-generated tables are then produced for each sample group showing the results of each survey question.
Survey participant responses are balanced to mirror the U.S. Census Bureau’s demographic and geographic distributions for the U.S. population. Wireless use and subscription information is also used to align the response groups. The following factors are incorporated into the weighting scheme: age, gender, education, income, employment status, race/ethnicity, acculturation, and area population. Wireless phone usage and market share among competing providers is balanced against information available through Nielsen Mobile’s Flowshare Metrics penetration and share measurement products.
Findings reported here are based on an online, self-administered follow-up survey with a subsample of 4,265 apps downloaders originally identified in Nielsen’s Mobile Insights survey of cell phone subscribers. The App Playbook follow-up survey was conducted in December of 2009, and screened for “recent downloaders”—those who had downloaded an app in the past 30 days. The full Nielsen Mobile Insights data includes teen as well as adult cell phone subscribers, but for this report, percentages are based only on the 3,962 adults ages 18 and older who had downloaded an app in the past 30 days. The App Playbook sample is weighted back to the total qualified population from the Nielsen Mobile Insights survey.
Topline
The topline is available to download as a PDF here. You can also explore the questions online on the report overview page.


