Acknowledgments
On behalf of the Pew Internet & American Life Project, the authors would like to acknowledge the contributions to this study by the following people: Alan Heaps and Sandra Riley of The College Board, Richard Sterling and Judy Buchanan of the National Writing Project, as well as the members of the Advisory Board to the National Commission on Writing and Jessica Vitak, Pew Internet Research Intern.
About this partnership: In the spring of 2007, the Pew Internet & American Life Project and the National Commission on Writing joined together to undertake a multi-modal study of the relationship between writing and technology for America’s youth. Funds for this research were provided by The College Board and the Pew Internet Project provided support for staff time devoted to it. The National Commission on Writing and The College Board may make policy recommendations to legislators and educators based on these results. The Pew Internet Project is non-partisan and should not be considered an advocate for those recommendations. The Project does not advocate for any policy outcome or policy change.
About the Pew Internet & American Life Project: The Pew Internet Project is an initiative of the Pew Research Center, a nonprofit “fact tank” that provides information on the issues, attitudes and trends shaping America and the world. Pew Internet explores the impact of the internet on children, families, communities, the work place, schools, health care and civic/political life. The Project does not take policy positions. Support for the project is provided by The Pew Charitable Trusts. The project’s Web site: https://www.pewresearch.org/internet
About the National Commission on Writing for America’s Families, Schools and Colleges: In an effort to focus national attention on the teaching and learning of writing, the College Board established the National Commission on Writing for America’s Families, Schools, and Colleges in September 2002. The decision to create the Commission was animated in part by the Board’s plans to offer a writing assessment in 2005 as part of the new SAT®, but the larger motivation lay in the growing concern within the education, business, and policy-making communities that the level of writing in the United States is not what it should be. http://www.writingcommission.org/
About Princeton Survey Research Associates: PSRA conducted the survey that is covered in this report. It is an independent research company specializing in social and policy work. The firm designs, conducts, and analyzes surveys worldwide. Its expertise also includes qualitative research and content analysis. With offices in Princeton, New Jersey, and Washington, D.C., PSRA serves the needs of clients around the nation and the world. The firm can be reached at 911 Commons Way, Princeton, NJ 08540, by telephone at 609-924-9204, or by email at ResearchNJ@PSRA.com
About Research Images: Research Images conducted the focus groups that helped guide the development of the PRSA survey and were the source of the quotes noted in the report. Research Images provides independent research, evaluation, and strategic-planning services to public and private organizations nationally and internationally. It specializes in using qualitative methods to inform policy and has strong subject area expertise in social uses of technology in education and non-education settings. Contact Research Images at 202-321-0676 or info@researchimages.com.
Methodology
The Parent & Teen Survey on Writing, sponsored by the Pew Internet and American Life Project, obtained telephone interviews with a nationally representative sample of 700 12 to 17 year olds and their parents in continental U.S. telephone households. The survey was conducted by Princeton Survey Research Associates International. The interviews were done in English by Princeton Data Source, LLC from September 19 to November 16, 2007. Statistical results are weighted to correct known demographic discrepancies. The margin of sampling error for the complete set of weighted data is ±4.7%. Details on the design, execution and analysis of the survey are discussed below, followed by a discussion of the methods used for conducting the focus groups that also inform this study.
Design & Data Collection Procedures
Sample Design
The sample was designed to represent all teens ages 12 to 17 living in continental U.S. telephone households and to allow separate analysis of black and Hispanic respondents. This design uses random-digit dialing (RDD) methods, where telephone numbers are drawn disproportionately from area code-exchange combinations with higher than average densities of black and Hispanic households. While this method increases the proportion of respondents in this target groups, special weighting adjustments restore the overall representativeness of the sample.
The telephone sample was provided by Survey Sampling International, LLC (SSI) according to PSRAI specifications. The sample was drawn using standard list-assisted random digit dialing (RDD) methodology. Active blocks of telephone numbers (area code + exchange + two-digit block number) that contained three or more residential directory listings were included in the sampling frame; after selection two more digits were added randomly to complete the phone numbers. This method guarantees coverage of every assigned phone number regardless of whether that number is directory listed, purposely unlisted, or too new to be listed. After selection, the numbers were compared against business directories and matching numbers purged.
Contact Procedures
Interviews were conducted from September 19 to November 16, 2007. As many as 10 attempts were made to contact every sampled telephone number. Sample was released for interviewing in replicates, which are representative subsamples of the larger sample. Using replicates to control the release of sample ensures that complete call procedures are followed for the entire sample. Calls were staggered over times of day and days of the week to maximize the chance of making contact with potential respondents. Each household received at least one daytime call in an attempt to find someone at home.
In each contacted household, interviewers first determined if a child age 12 to 17 lived in the household. Households with no children in the target age range were screened out as ineligible. For eligible households, interviewers first conducted a short interview with a parent or guardian and then interviews were conducted with the target child.4
Weighting and analysis
Weighting is generally used in survey analysis to adjust for effects of the sample design and to compensate for patterns of nonresponse that might bias results. The weighting was accomplished in two stages: a first-stage sampling weight to adjust for the designed oversampling in minority areas, and a second-stage adjustment to account for demographic distortions due to non-response.
First Stage: Sample Design Weight
All completed interviews were given a first stage sample weight based on the level of disproportionality imposed by the sample design. Telephone exchanges were divided into strata defined by black and Hispanic household densities associated with each exchange. The first stage weight for each stratum is the approximate proportion of active blocks in each stratum divided by the proportion in our sample. The weighted distribution of cases contacted across strata will no longer show effects of the designed oversampling.
Second Stage: Demographic Adjustment
In the second weighting stage, the demographic composition of final sample was weighted to match national parameters for both parent and child demographics. The parent demographics used for weighting were: sex; age; education; race; Hispanic origin; marital status and region (U.S. Census definitions). The child demographics used for weighting were gender and age. These parameters came from a special analysis of the Census Bureau’s 2006 Annual Social and Economic Supplement (ASEC) that included all households in the continental United States that had a telephone.
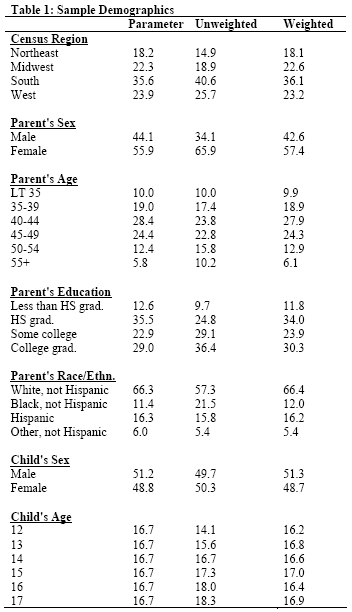
This stage of weighting, which incorporated each respondent’s first stage weight, was accomplished using Sample Balancing, a special iterative sample weighting program that simultaneously balances the distributions of all variables using a statistical technique called the Deming Algorithm. The second stage weight adjusts for non-response that is related to particular demographic characteristics of the sample. This weight ensures that the demographic characteristics of the sample closely approximate the demographic characteristics of the target population. Finally, weights from this stage were trimmed to prevent individual interviews from having too much influence on the final results. Table 1 compares weighted and unweighted sample distributions to population parameters.
Effects of Sample Design on Statistical Inference
Post-data collection statistical adjustments require analysis procedures that reflect departures from simple random sampling. PSRAI calculates the effects of these design features so that an appropriate adjustment can be incorporated into tests of statistical significance when using these data. The so-called “design effect” or deff represents the loss in statistical efficiency that results from systematic non-response. The total sample design effect for this survey is 1.62.
PSRAI calculates the composite design effect for a sample of size n, with each case having a weight, wi as:
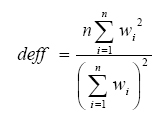
In a wide range of situations, the adjusted standard error of a statistic should be calculated by multiplying the usual formula by the square root of the design effect (√deff ). Thus, the formula for computing the 95% confidence interval around a percentage is:

where pˆ is the sample estimate and n is the unweighted number of sample cases in the group being considered.
The survey’s margin of error is the largest 95% confidence interval for any estimated proportion based on the total sample— the one around 50%. For example, the margin of error for the entire sample is ±4.7%. This means that in 95 out every 100 samples drawn using the same methodology, estimated proportions based on the entire sample will be no more than 4.7 percentage points away from their true values in the population. It is important to remember that sampling fluctuations are only one possible source of error in a survey estimate. Other sources, such as respondent selection bias, questionnaire wording and reporting inaccuracy, may contribute additional error of greater or lesser magnitude.
Response Rate
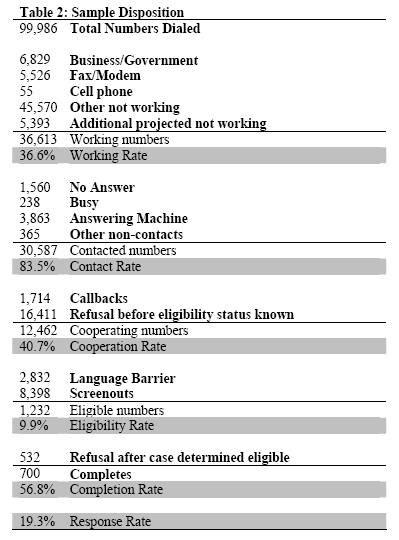
Table 2 reports the disposition of all sampled telephone numbers ever dialed. The response rate estimates the fraction of all eligible respondents in the sample that were ultimately interviewed. At PSRAI it is calculated by taking the product of three component rates:5
- Contact rate – the proportion of working numbers where a request for interview was made – of 84 percent6
- Cooperation rate – the proportion of contacted numbers where a consent for interview was at least initially obtained, versus those refused – of 41 percent
- Completion rate – the proportion of initially cooperating and eligible interviews that agreed to the child interview and were completed – of 57 percent
Thus the response rate for this survey was 19 percent. See page 72 for detailed response rate table.
Focus Group Methodology7
This report also draws upon data collected from eight focus groups held throughout the United States between April and June 2007. Research Images developed the protocols and facilitated the groups, with recruiting conducted by PRSA. Two focus groups were conducted in a medium to large city in each of the following geographical areas: the Southwest, Northeast, Midwest and Northwest. In total, 73 youths participated in the groups, with participants ranging in age from 12 to 17 years old and spanning grades 7 through 12.
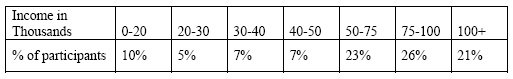
These focus groups were not intended to be representative of the general U.S. population, but were intended to include a relatively diverse cross-section of teens with respect to age, gender, household income, geographic location and race/ethnicity. Participants were approximately half male (47%) and half female (53%). With respect to racial/ethnic background, the majority of participants were Caucasian (80%) or Black (16%), with the remainder including those who identified as Hispanic or Other (no designation). Just over 20% of participants came from families with an annual household income of $40,000 dollars or less. The following table shows the percentage of study participants by household income level:
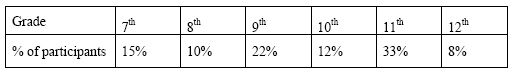
Two focus groups contained participants of mixed gender and age. Of these, one was comprised of low-income teens (those from families with an annual household income of $30,000 or less). The remaining six focus groups included single sex participants within the same age group – one male and one female group each for grades 7-8, 9-10, and 11-12. The following table shows the percentage of study participants by grade level:
Participants answered two questions before commencing their particular focus group and their responses were used as points of departure for the focus group discussions. A standard facilitator-led questioning protocol was followed for each 1.5-hour group and participants were also asked to each complete a brief questionnaire.