
January 2005 Daily Tracking Survey
Final Topline, 2/11/05
Data for January 13 – February 9, 2005
Princeton Survey Research Associates International for the Pew Internet & American Life Project
Sample: n = 2,201 adults 18 and older
Interviewing dates: 01.13.05 – 02.09.05
- Margin of error is plus or minus 2 percentage points for results based on the full sample [n=2,201]
- Margin of error is plus or minus 3 percentage points for results based on internet users [n=1,421]
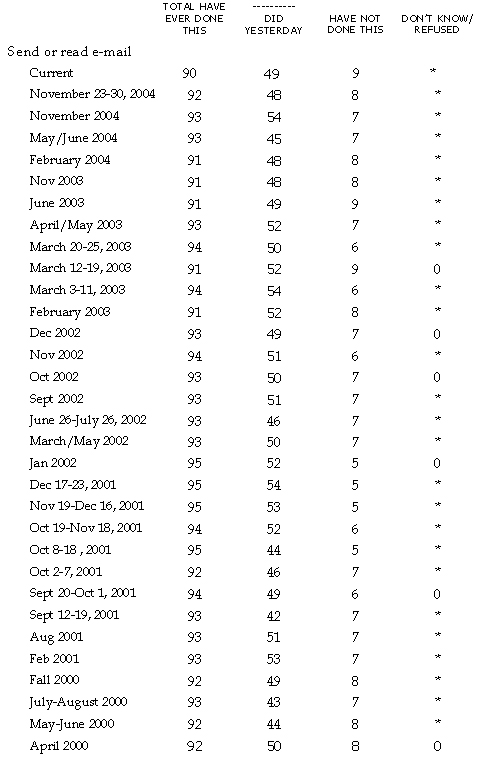
WEB1 Please tell me if you ever use the internet to do any of the following things. Do you ever use the internet to…/Did you happen to do this yesterday, or not?2
[N=1,421]
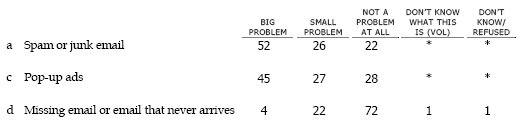
Q19 I’m going to read a list of things that are sometimes a problem for internet users. Please tell me if, for you personally, each one is a BIG problem, a SMALL problem, or NOT a problem at all.
Based on internet users [N=1,421]
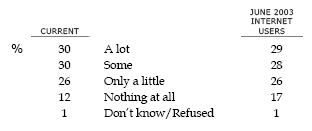
SP1 How much have you heard or read about SPAM, or junk email? Have you heard or read…?
Based on internet users [N=1,421]
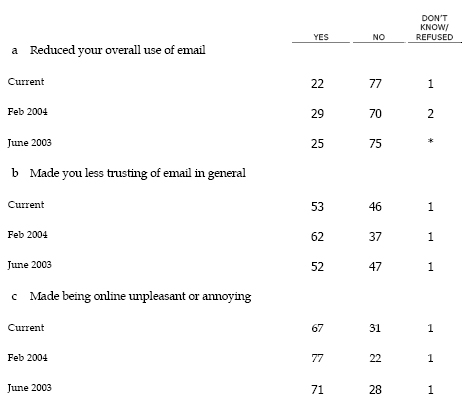
SP2 We’d like to know if unsolicited email, or spam, has affected you in any of the following ways. Has spam…?
Based on email users [N=1,295]
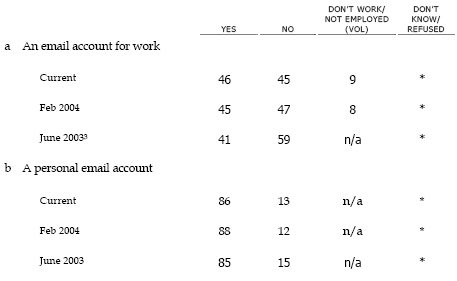
SP4 Thinking about your email… Do you have…3
Based on email users [N=1,295]
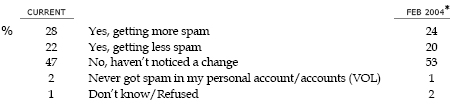
SP5 Thinking just about your PERSONAL email account…In the past 12 months, have you noticed any change in the amount of spam you receive in your PERSONAL email account? IF YES: Are you getting MORE or LESS spam in your PERSONAL email than you were before?4
Based on those with personal email account [N=1,116]
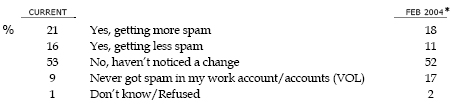
SP6 Thinking just about your WORK email account… In the past 12 months, have you noticed any change in the amount of spam you receive in your WORK account? IF YES: Are you getting MORE or LESS spam in your WORK email than you were before?5
Based on those with work email account [N=599]
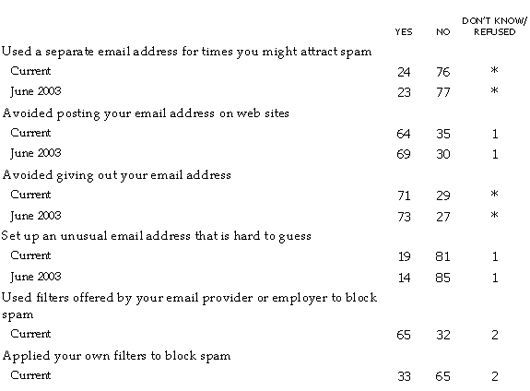
SP18 We’d like to know if you have ever done the following things to avoid receiving spam or junk email in an email account. Have you ever…?
Based on email users [N=1,295]
SP31 If you received…[INSERT; ROTATE] would you think of this as spam, or not?
Based on email users [N=1,295]
![SP31 If you received…[INSERT; ROTATE] would you think of this as spam, or not?](https://www.pewresearch.org/internet/wp-content/uploads/sites/9/media/629F1B20DF514612A8E4DE679ED703D0.jpg)
SP3 Thinking about all of the times you’ve received unsolicited email, have you ever…?
Based on Email users [N=1,295]
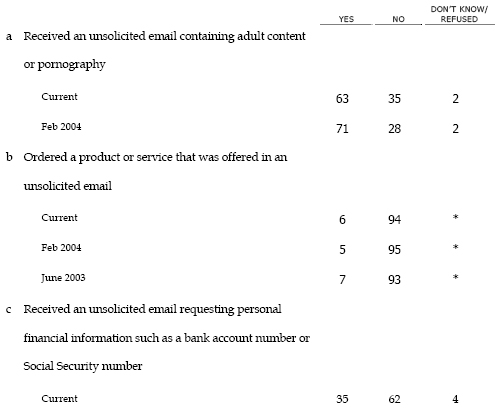
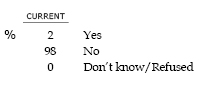
SP7a Have you ever provided personal financial information that was requested in an unsolicited email?
Based on those who have gotten unsolicited email requesting personal financial information [N=460]
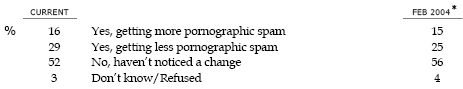
SP7b In the past 12 months, have you noticed any change in the amount of PORNOGRAPHIC spam you receive? IF YES: Are you getting MORE or LESS pornographic spam than you were before?6
Based on those who received pornographic spam [N=822]
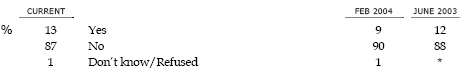
SP8 Have you ever responded to an email offer, only to find out later it was phony or fraudulent?
Based on email users [N=1,295]
Methodology
This report is based on the findings of a daily tracking survey on Americans’ use of the Internet. The results in this report are based on data from telephone interviews conducted by Princeton Survey Research Associates between January 13 to February 9, 2005, among a sample of 2,201 adults, 18 and older. For results based on the total sample, one can say with 95% confidence that the error attributable to sampling and other random effects is plus or minus 2.2 percentage points. For results based Internet users (n=1,421), the margin of sampling error is plus or minus 2.7 percentage points. The margin of error for estimates based on Form A or Form B respondents is plus or minus 3.2 percentage points. In addition to sampling error, question wording and practical difficulties in conducting telephone surveys may introduce some error or bias into the findings of opinion polls.
The sample for this survey is a random digit sample of telephone numbers selected from telephone exchanges in the continental United States. The random digit aspect of the sample is used to avoid “listing” bias and provides representation of both listed and unlisted numbers (including not-yet-listed numbers). The design of the sample achieves this representation by random generation of the last two digits of telephone numbers selected on the basis of their area code, telephone exchange, and bank number.
New sample was released daily and was kept in the field for at least five days. The sample was released in replicates, which are representative subsamples of the larger population. This ensures that complete call procedures were followed for the entire sample. At least 10 attempts were made to complete an interview at sampled households. The calls were staggered over times of day and days of the week to maximize the chances of making contact with a potential respondent. Each household received at least one daytime call in an attempt to find someone at home. In each contacted household, interviewers asked to speak with the youngest male currently at home. If no male was available, interviewers asked to speak with the oldest female at home. This systematic respondent selection technique has been shown to produce samples that closely mirror the population in terms of age and gender. All interviews completed on any given day were considered to be the final sample for that day. The overall response rate was 30.1%.
Non-response in telephone interviews produces some known biases in survey-derived estimates because participation tends to vary for different subgroups of the population, and these subgroups are likely to vary also on questions of substantive interest. In order to compensate for these known biases, the sample data are weighted by form in analysis. The demographic weighting parameters are derived from a special analysis of the most recently available Census Bureau’s 2004 Annual Social and Economic Supplement (March 2004). This analysis produces population parameters for the demographic characteristics of adults age 18 or older, living in households that contain a telephone. These parameters are then compared with the sample characteristics to construct sample weights. The weights are derived using an iterative technique that simultaneously balances the distribution of all weighting parameters.


