
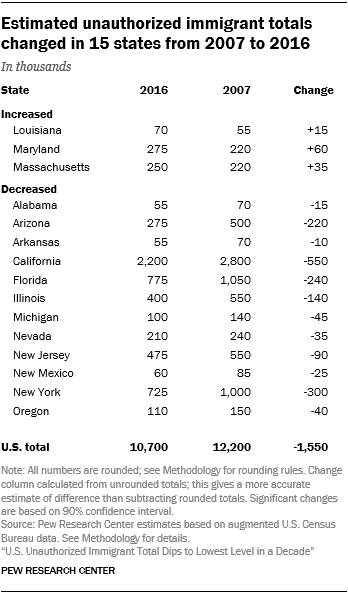
From 2007 to 2016, the estimated unauthorized immigrant population declined in a dozen states and rose in three. Other states may have undergone changes, but that cannot be determined definitively because of the margin of error in the data.
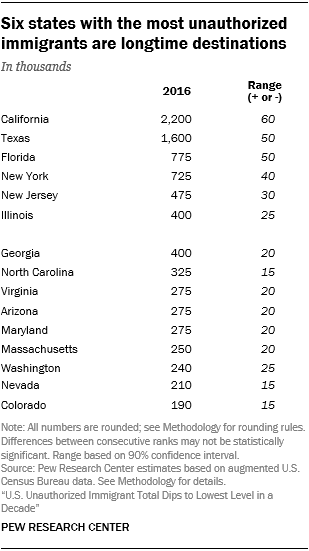
Among the states with losses since 2007 were most of those with the largest unauthorized immigrant populations, including California, Florida, Illinois, New Jersey and New York. Along with Texas (where the unauthorized immigrant population was stable), these states are home to 58% of unauthorized immigrants in 2016.
Another state with a notable loss since 2007 was Arizona, whose unauthorized immigrant population fell by 44% since its peak that year. Arizona had ranked seventh among states for the size of its unauthorized immigrant population; in 2016, it ranked 10th. Arizona has enacted immigration enforcement laws in past years that include requiring employers to use a federal electronic database called E‑Verify to check the legal status of employees; requiring law enforcement to inquire about immigration status during a lawful stop; and making unauthorized immigrant students ineligible for in-state college tuition rates.
Other states with losses from 2007 to 2016 were Alabama, Arkansas, Michigan, Nevada, New Mexico and Oregon.
Over a more recent time span – 2014 to 2016 – unauthorized immigrant populations declined in eight states: Arizona, Arkansas, California, Illinois, Kentucky, New Mexico, North Carolina and Oregon. Only one state – California, which has the country’s largest unauthorized immigrant population – had a statistically significant decline in its unauthorized immigrant population from 2015 to 2016.
For a table showing unauthorized immigrant populations for selected years in all states, not just those with statistically significant changes, see Appendix C.
The six states where most unauthorized immigrants live are home to a somewhat smaller share than in 2007 (61% in 2007 vs. 58% in 2016). But those states’ share of the total is down markedly from a decade earlier: More than three-quarters of unauthorized immigrants lived in the six states in 1995.
States with increases
Only three states had increases in their unauthorized immigrant populations since 2007. Unauthorized immigrant populations grew in Maryland (where the three Northern Triangle nations are the largest birth countries), Massachusetts (where El Salvador is the top birth country) and Louisiana (where Mexico, Honduras and Guatemala are the top birth countries), in contrast to the national decrease. The total in Massachusetts also rose from 2015 to 2016.
State workforce trends
Twelve states experienced statistically significant declines in the size of their unauthorized immigrant workforces from 2007 to 2016, while eight states had increases.
Among states with the largest unauthorized immigrant workforces, California, Florida, Illinois, New Jersey and New York had lower numbers in 2016 than in 2007, and unauthorized immigrants also became a smaller share of the total workforce. Texas experienced a gain in its unauthorized immigrant workforce number during that period. However, unauthorized immigrants were a smaller share of the total workforce in Texas in 2016, compared with 2007, because other groups in the workforce grew more rapidly.
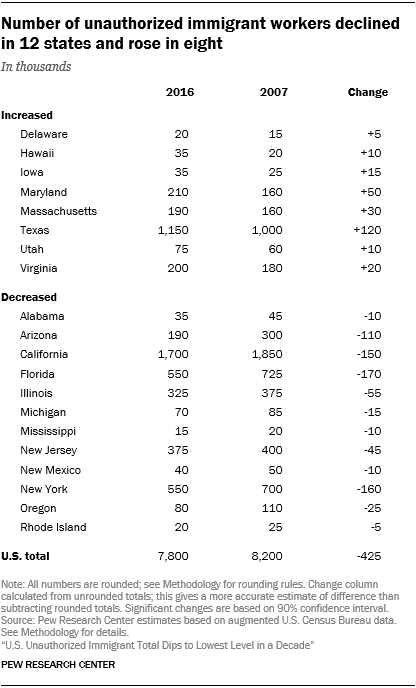
Arizona’s unauthorized immigrant workforce shrank by more than a third since 2007. The smaller labor force of unauthorized immigrants in Arizona means that the state ranked 12th in 2016 for the size of its unauthorized immigrant workforce, compared with seventh in 2007. Unauthorized immigrants also made up a smaller share of the workforce in Arizona in 2016 than in 2007.
In Maryland, meanwhile, the number of unauthorized immigrants in the workforce grew by about a third since 2007. Maryland had ranked 14th in 2007 for the size of its unauthorized immigrant workforce, but in 2016 ranked ninth. Unauthorized immigrants made up a larger share of the total workforce in Maryland in 2016 than in 2007. Neighboring Virginia also gained more unauthorized immigrant workers, but their share of the total workforce did not grow.
The remaining states states with fewer unauthorized immigrants in the workforce in 2016 than in 2007 were Alabama, Michigan, Mississippi, New Mexico, Oregon and Rhode Island. In addition to Texas, Maryland and Virginia, states with more unauthorized immigrants in the workforce in 2016 than in 2007 were Delaware, Hawaii, Iowa, Massachusetts and Utah.
For a table listing the workforce totals for all states, not just those with statistically significant changes, see Appendix C.
