Updated August 13, 2015: This new edition includes corrected estimates for Iceland, Luxembourg, the Netherlands and Taiwan, and some related aggregated data.
The global middle-income population is nearing the 1 billion mark. In the 111 countries included in this study, the middle-income population nearly doubled from 398 million in 2001 to 783 million in 2011.24 As discussed in the next section, much of this increase—203 million—emanated from China alone. The remainder of the growth was principally located in Eastern Europe and South America.
The most notable changes from 2001 to 2011 were the decrease in poverty and the increase in the low-income population. The number of people who were poor fell from 1.6 billion in 2001 to 949 million in 2011, or by 669 million. In this same period, the low-income population increased from 2.7 billion to 3.4 billion, or by 694 million.
The increase in the low-income population was nearly two times as much as the increase in the middle-income population. It was also concentrated in Africa and Asia. Economic growth in China and India was instrumental to this process, as the two countries combined pulled 489 million people out of poverty and added 435 million to the global low-income population. Overall, the comparative changes in the low-income and middle-income populations demonstrate that crossing the $10 threshold persisted as a difficult challenge in the first decade of the 21 century.
The global population share that is upper-middle income increased from 408 million in 2001 to 583 million in 2011, a change of about 175 million, and the high-income population increased from 340 million to 428 million, a change of 88 million during that decade. These gains were scattered mostly among more advanced economies in North America and Europe, in countries that are considered by the World Bank to be upper-middle income or high income.
Regional Patterns in the Distributions of Populations by Income
There is a distinct regional pattern to the distribution of people by income. Vast majorities of people in Africa and Asia & South Pacific are either poor or low income. In sharp contrast, most people in North America and Europe are either upper-middle income or high income. The standards of living in South America and Central America & the Caribbean fall in between.25
Below is a summary of some of the key regional patterns in terms of population distribution by income. In addition, these patterns are illustrated in a series of maps that follows.
Asia & South Pacific and Africa
Asia & South Pacific is one of the poorest regions in the world but, propelled by economic growth in China, is also home to an emerging middle-income population. The share of Asia & South Pacific’s population that is poor more than halved, falling from 36% in 2001 to 16% in 2011. Over the same period, the share that is low income increased from 58% to 69%, and the share that is middle income rose from 4% to 11%. As detailed in later sections, economic reforms in China and India were the key contributors to the decline in the region’s poverty, but the growth in the middle-income population was realized largely in China.
Africa is the poorest region in the world. Nearly four-in-ten Africans (39%) were poor in 2011, although this share is down notably from 2001 when about half (49%) lived in poverty.26 The formerly poor appear to have transitioned mostly into low-income status, as the share of this group of Africans increased from 45% in 2001 to 54% in 2011. Thus, the share of Africa’s population that is either poor or low income barely changed from 2001 to 2011, edging down from 94% to 92% in that decade. Middle-income people in Africa represented only 6% of the population in 2011, virtually unchanged from 2001.
Latin America
South America started from a higher place than Asia & South Pacific or Africa in 2001—less poor and more middle income—and raised the share of its middle-income population by more over the course of the decade. In 2001, the poverty rate in South America was 17%, and it took until 2011 for the poverty rate in Asia & South Pacific to fall below that level. By then, the poverty rate in South America had fallen to 7%. The proportion of the population that is low-income also fell in South America, from 55% in 2001 to 46% in 2011.
Through a combination of economic growth and income redistributing policies,27 the end result for South America is an increase in the share of middle-income population from 16% to 27% and an increase in the share of the population that is upper-middle income from 9% to 15%. Overall, 47% of South America’s population lived at or above the middle-income level in 2011. Thus, South America is near the threshold when the majority of its population lives at or above the middle-income standard.
Little changed in the distribution of the population by income in Central America & the Caribbean from 2001 to 2011. Poverty modestly declined in the region, from 13% in 2001 to 10% in 2011, and the share of its middle-income population modestly increased, from 19% to 21%. Most people in Central America & the Caribbean are low income—the share of this income group was 57% in 2001 and 56% in 2011.
Europe and North America
Europe and North America are home to most of the world’s advanced economies. Thus, by global standards, poverty in these regions is virtually absent and the shares of low-income and middle-income populations are relatively low. Instead, majorities of their populations are either upper-middle income or high income.
The Great Recession of 2007-2009 was a setback to economic growth in both North America and Europe. Most prominently, the U.S. economy stumbled through the decade from 2001 to 2011, growing at less than 1% annually on average.28 Even these slight gains did not make their way to American families whose median income actually decreased from 2001 to 2011.29 Since the U.S. dominates the North American region, economically and demographically, stagnation there translated to regionwide stasis.
Due to the lackluster performance of the U.S. economy, there was no substantial change in the income distribution in North America from 2001 to 2011. The share of the middle-income population in the region moved up from 10% in 2001 to 12% in 2011, the share of the low-income population inched up from 17% to 18%, and the share of the high-income population eased down from 43% to 42%.
Most economies in Western Europe also experienced modest growth from 2001 to 2011. However, unlike in the U.S., this did result in an increase in family incomes in many countries.30 Also, the transition countries in Eastern Europe, including the former Soviet republics, entered the recession on a stronger path to growth and weathered its effects better. For these reasons, Europe overall showed more economic progress than North America in the 2000s.31
In Europe, 31% of the population was low income in 2001 and this share was cut in half to 15% by 2011. The gains were scattered through the middle and higher reaches of the income distribution. The share of the European population that is middle income increased from 20% in 2001 to 24% in 2011, the share that is upper-middle income rose from 29% to 36%, and the share of the high-income population expanded from 19% to 26%.
North America does retain the distinction of being the highest income region in the world. In 2011, 42% of the population in North America was high income, living on more than $50 per day, compared with 26% in Europe. But a smaller proportion of Europe’s population is poor or low-income compared with North America—15% vs. 19%. Put another way, proportionally more Europeans (85%) than North Americans (81%) are at least middle income, living on $10 or more daily in 2011.
Picturing the Global Population in Maps, by Income
The maps that follow depict the shares of populations, within broad ranges, that are poor, low income, middle income, upper-middle income and high income in individual countries in 2011. More precise information on each country is presented in the appendix. The maps reveal the following at a glance:
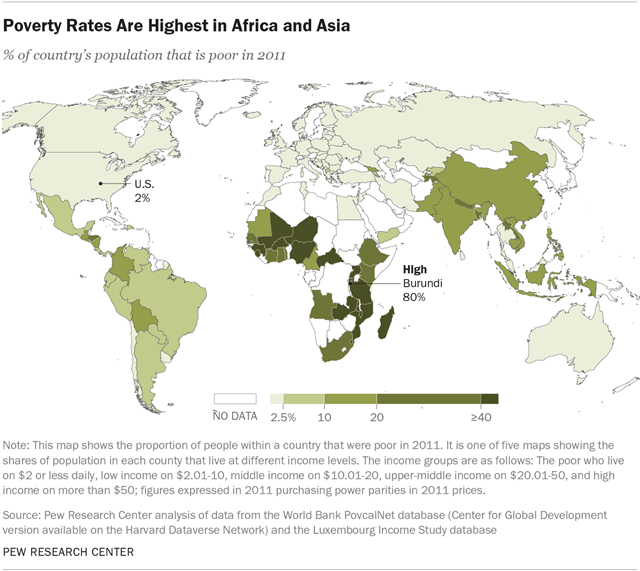
Countries in Africa and Asia are the poorest. The share of the population that is poor exceeds 40% in several countries in Africa, topping out at 80% in Burundi.
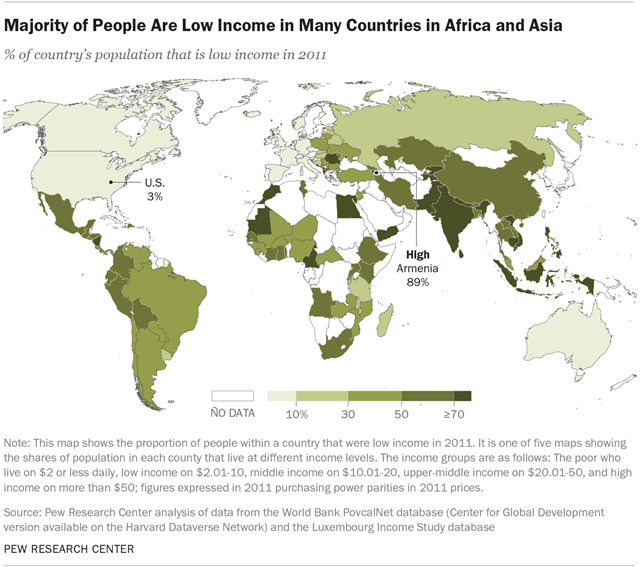
A low-income status is the prevalent standard for people in most of Africa and Asia. Some nine-in-ten people (89%) in Armenia are low income.
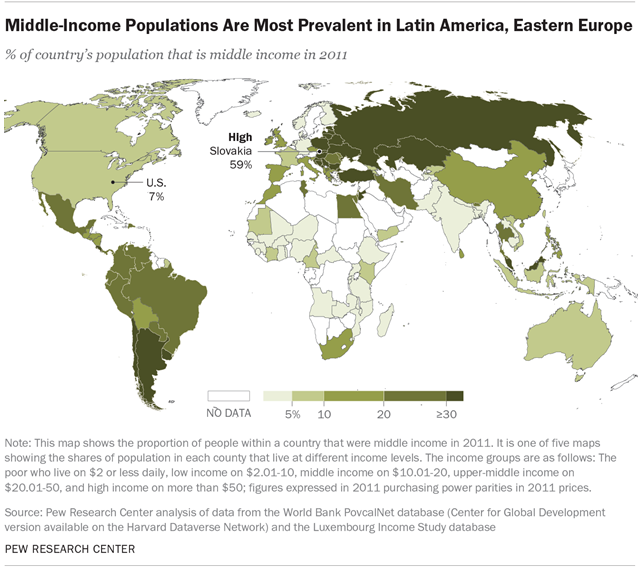
As a share of the country’s population, middle-income families are more commonplace in Eastern Europe, which includes Russia, and in Latin America. In Slovakia, 59% of the population is middle income.
Populations that are upper-middle income are concentrated in North America and Western Europe but are emergent in parts of Eastern Europe and South America. Slovenia, where 71% of the population is upper-middle income, leads this group.
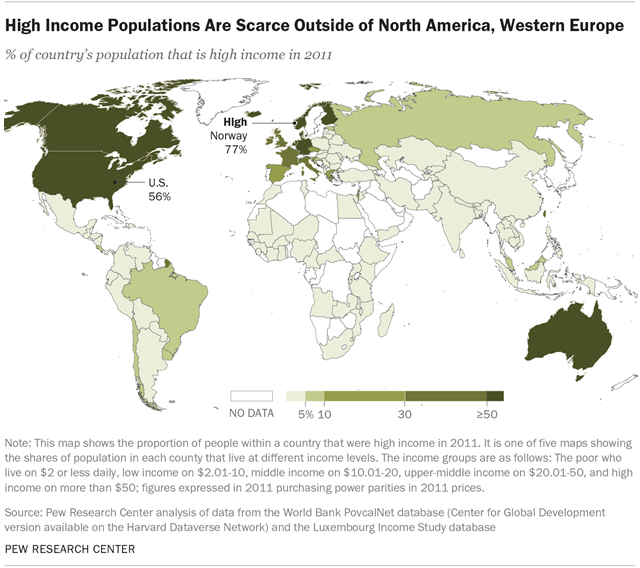
Outside of North America and Western Europe, few countries have significant high-income populations. More of Norway’s population is high income—77%—than any other country included in the study.
Where in the World Are the New Middle Classes?
Globally, the middle-income population increased by 386 million from 2001 to 2011. More than half of this increase—203 million—emanated from China alone. Other key contributions came from countries in South America, which collectively raised the middle-income population by 50 million, and Eastern Europe, which added 39 million.
The role of advanced economies in the growth of the new middle classes was limited. That is because most residents in these countries are already either upper-middle income or high income by global standards. In fact, the middle-income population in Western Europe actually decreased from 2001 to 2011 as people moved into higher income brackets (see the final section of the report on trends in advanced economies.)
This section summarizes trends in countries and regions responsible for most of the growth in the share of the world’s population that is middle income. More detailed information on the income distributions in these and other countries is in the appendix.
China Makes a Strong Push Up the Ladder
Economic developments in China are instrumental in shaping global trends. China currently ranks as the world’s largest economy and is home to about one-in-five people globally.32 Thanks to rapid economic growth in the first decade of the new century, China emerged as the principal contributor to an expanding global middle-income population.
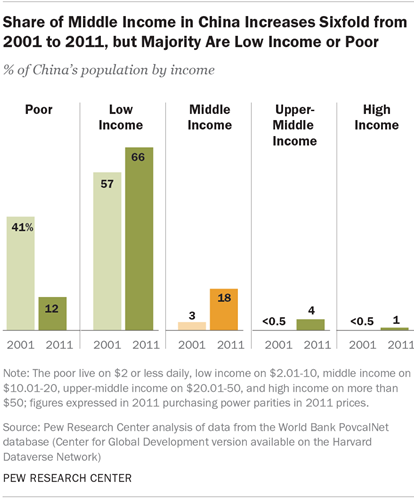
From 2001 to 2011, the poverty rate in China fell from 41% to 12%, resulting in the movement of 356 million people out of poverty. Some of this led to an increase in China’s low-income population. The size of this group, one step out of poverty but not yet middle income, increased by 163 million, and its share rose from 57% to 66%.
China had even more success increasing the size of its middle-income population, which jumped from 32 million in 2001 to 235 million in 2011, an increase of 203 million. The share of the middle-income population rose from 3% to 18%, a sixfold increase in the span of a single decade.
The increase in Chinese who are upper-middle income and high income is also notable. Barely discernible in 2001, only 4 million people in China were estimated to be either upper-middle income or high income in that year. By 2011, the combined size of these groups had increased to 67 million, accounting for 5% of China’s population.
Rising living standards in China are also evident in the earnings of its residents. In 2001, the most prevalent standard of living in China was $2 per day, with 31% of its population living on that amount. By 2011, the share living on just $2 plunged 22 percentage points, to 9%. Over the same period, the median daily per capita income in China increased $2.36 to $5.34, a gain of 126%.33
As China added to its middle-income population, its share in the global middle class nearly quadrupled from 2001 to 2011. In 2001, the 32 million middle-income people in China accounted for 8% of the global middle-income population. In 2011, China’s middle-income population of 235 million accounted for 30% of the global middle-income population.
Recent progress notwithstanding, China’s journey is far from complete. Despite impressive economic growth and upward mobility for millions, more than three-fourths of its population remained poor (12%) or low income (66%) in 2011. And although this is down considerably from 2001, when 97% of Chinese were either poor or low income, a sizable gap in living standards remains between China and advanced economies.
The Growing Middle Class in South America and Mexico
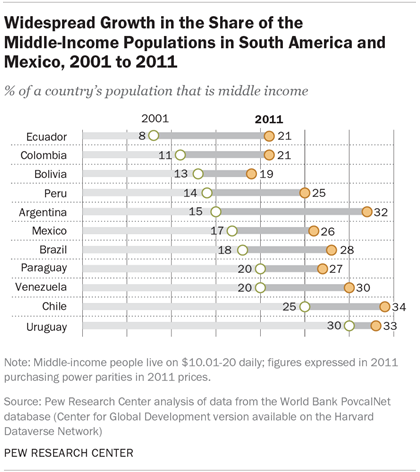
In South America, booming commodity prices and income redistribution policies helped spur the growth of populations that are middle income and upper-middle income. Some countries, such as Argentina and Chile, transformed from being majority low income or poor in 2001 to being majority middle-income or better in 2011. Brazil ended the decade close to this tipping point. Mexico kept pace with its neighbors to the south, joining the ranks of countries in which about a quarter (26%) of the population is middle income.
The 10 countries from South America included in this study represent nearly 100% of the region’s population. These countries and Mexico realized noticeable growth in their populations that are middle income and upper-middle income. In 2001, the middle-income share of the population was 20% or higher in only four countries. By 2011, this was true in Mexico and in nine of the 10 countries in South America.
The most notable growth in the middle-income population was in Argentina, where the share more than doubled from 15% in 2001 to 32% in 2011. Sizable growth also occurred in Ecuador (up from 8% to 21%), Colombia (11% to 21%), Peru (14% to 25%), Brazil (18% to 28%), and Venezuela (20% to 30%). The share in Mexico increased from 17% to 26% during the first decade of the 21st century.
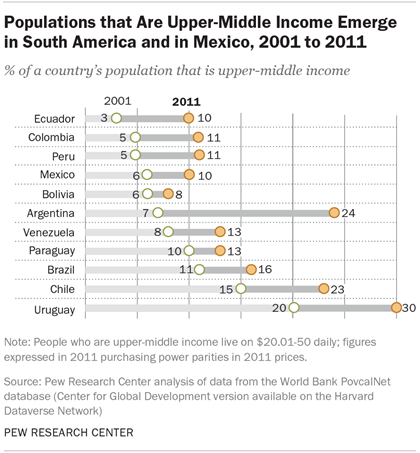
Similarly, the share of the populations that are upper-middle income climbed into the double digits in 10 of the 11 countries by 2011, compared with four countries in 2001. Argentina again led the way; those who are upper-middle income constituted 7% of the population in 2001 and 24% in 2011. Significant changes also took place in Uruguay, where the share increased from 20% to 30%, and in Chile where the share rose from 15% to 23%.
Collectively, the 11 Latin American countries highlighted in this section added 63 million people to the global middle-income population from 2001 to 2011, accounting for 16% of the global increase. They also added 36 million to the global population of those who are upper-middle income, which amounted to 20% of the increase worldwide. Somewhat ironically, the share of these countries in the global middle-income population fell from 19% in 2001 to 18% in 2011, a side effect of China’s dominance in the global trend. But their global share of those who are upper-middle income did increase, rising from 9% to 13% over the course of the century’s first decade.
The countries in South America and Mexico are still some distance from having fully acquired middle-income status, however. Nearly two-thirds or more of the populations in Bolivia, Colombia, Ecuador, Mexico and Peru was poor or low income in 2011. And, generally speaking, South American countries are not yet in the same place as Eastern Europe with respect to developing middle-income or more well-to-do populations.
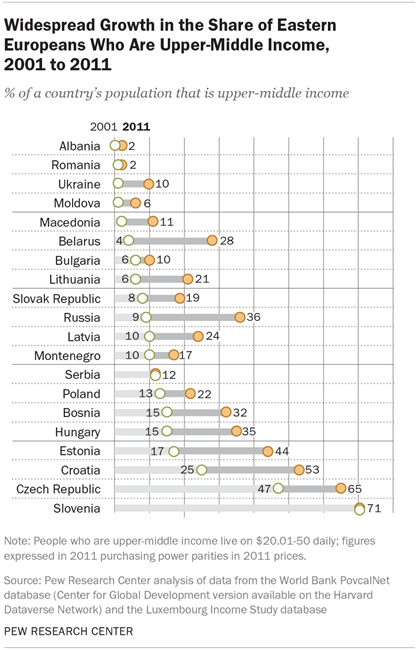
The Transition to Middle-Income Status in Eastern Europe
As countries in Eastern Europe transition from state-controlled to market economies, the share of their populations that is middle income or upper-middle income has expanded. In some cases this is a boomerang phenomenon, as economic gains offset earlier losses in the years immediately following the fall of the Berlin Wall and collapse of the Soviet Union. In Russia, for example, national income per capita decreased 24% from 1991 to 2001, but then it increased 62% from 2001 to 2011.34
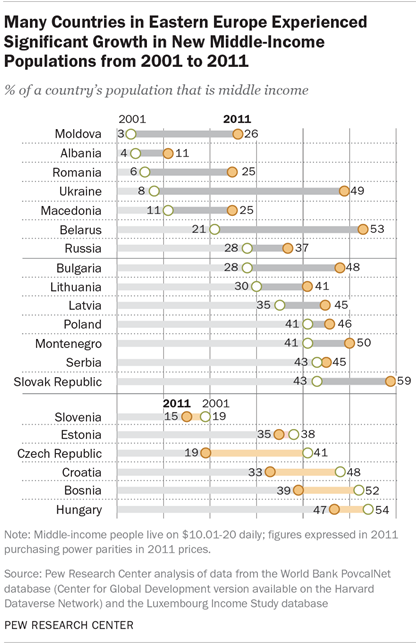
This study encompasses 20 countries in Eastern Europe accounting for 99% of the region’s population in 2011. In 2001, the share of middle-income people in these countries ranged from a low of 3% in Moldova to a high of 54% in Hungary. By 2011, the share ranged from 11% in Albania to 59% in the Slovak Republic. Hidden within this sweeping perspective are some remarkable gains in the share of middle-income earners.
The most notable increase in the middle-income population is in Ukraine, where the share of this group jumped from 8% in 2001 to 49% in 2011. Among others, noteworthy gains also occurred in Belarus (from 21% to 53%), Moldova (3% to 26%), Bulgaria (28% to 48%) and Romania (6% to 25%). In Russia, the middle-income population increased from 28% of the overall population in 2001 to 37% in 2011.
In six countries—Bosnia, Croatia, the Czech Republic, Estonia, Hungary and Slovenia—the share of the middle-income population is estimated to have fallen from 2001 to 2011. In the Czech Republic, for example, the share fell from 41% in 2001 to 19% in 2011. But these shifts are not a sign of economic regression. Instead, they are the result of people moving further up the economic ladder.
Indeed, the percentage of Eastern Europe’s population that could be considered upper-middle income increased significantly in the first decade of the 21st century. In Hungary, for instance, the share of those who are upper-middle income more than doubled from 15% in 2001 to 35% in 2011. A similar phenomenon occurred in Bosnia (where the share rose from 15% in 2001 to 32% in 2011), Estonia (17% to 44%) and Croatia (25% to 53%). In the Czech Republic, the share of those who are upper-middle income increased from 47% to 65%. Large gains in the share of those who are upper-middle income were also registered in Russia (up from 9% in 2001 to 36% in 2011), Belarus (4% to 28%) and Latvia (10% to 24%).
Collectively, the countries in Eastern Europe raised their middle-income population by 39 million, accounting for 10% of the global change from 2001 to 2011. These countries also boosted 56 million people to a status of upper-middle income in that decade, contributing 32% to the worldwide increase. But not all countries in Eastern Europe have transitioned into economies dominated by populations that are middle income or upper-middle income. Countries that are lagging include Albania, where 86% of the population was poor or low income in 2011. Likewise, a clear majority of people in Romania (73%), Macedonia (64%) and Moldova (68%) were poor or low income in 2011.35
Other Countries with Sizable Growth in the Middle Class
Besides China, South America and Eastern Europe, where has the middle class expanded the most between 2001 and 2011? In addition to the countries discussed in the section above, this section looks at the countries that round out the list of the top 30 nations in terms of growth in the share of middle-income populations, and separately, the list of the top 30 nations in terms of growth in the share of populations that are upper-middle income.36
Other Top countries in Terms of Middle-Income Gains
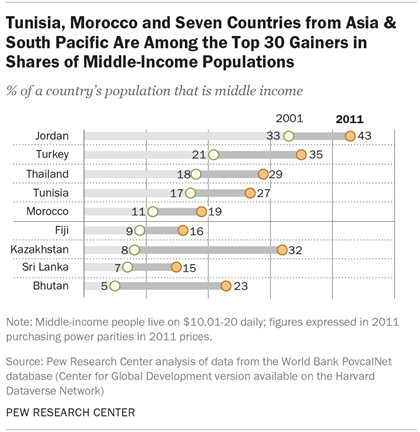
The nine countries that complete the list of the top 30 with the largest gains in the shares of their middle-income populations are mostly from Asia & South Pacific. These countries are Bhutan, Fiji, Jordan, Kazakhstan, Sri Lanka, Thailand and Turkey. Two countries from Africa, Morocco and Tunisia, round out the list.
In this group of countries, Jordan, Turkey and Kazakhstan lead in the share of the population that is middle income. In Jordan, the share in 2011 was 43%, up from 33% in 2001. The share also increased by double digits in Turkey, from 21% in 2001 to 35% in 2011. Kazakhstan experienced the greatest increase, with the share of its middle-income population jumping from 8% in 2001 to 32% in 2011.
In three countries—Thailand, Tunisia and Bhutan—about one-in-four people were middle income in 2011. All three also experienced double-digits gains in the shares from 2001 to 2011. Morocco, Fiji and Sri Lanka experienced slightly smaller gains in the share of middle-income earners, with all three nearing the day when at least one-in-five people within their borders will have attained middle-income status.
Collectively, this group of nine countries added 32 million people to the global middle-income population, 8% of the global increase of 386 million. Thailand and Turkey are the two most populous countries in the group and added 8 million and 12 million, respectively. Bhutan is the least populous of the group and contributed 139,000 people to the worldwide increase in the middle-income population.
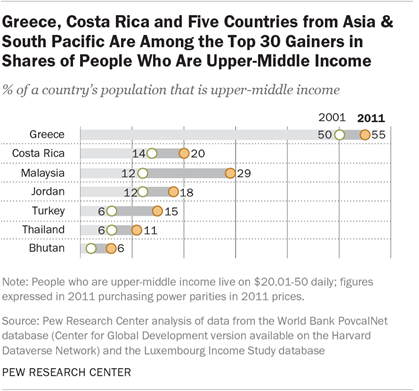
Other Top Countries in Terms of Gains among those who are Upper-Middle Income
The seven countries that exhaust the list of the top 30 with the largest gains in the shares of their populations that are upper-middle income are also mostly from Asia & South Pacific. These are Bhutan, Jordan, Malaysia, Thailand and Turkey. One country from Western Europe—Greece—and one from Central America—Costa Rica—finish off the list.
Greece, still counted as one of the advanced economies in the world by the International Monetary Fund, leads this group of countries in the share of the population that is upper-middle income. In 2011, 55% of people in Greece were upper-middle income, up from 50% in 2001.37 Among these countries, Malaysia experienced the greatest increase in the share that is upper-middle income, rising from 12% in 2001 to 29% in 2011. The share of the population that is upper-middle income is at or nearing 20% in Costa Rica, Jordan and Turkey.
The total increase from 2001 to 2011 in the population of those who are upper-middle income in these seven countries amounted to 17 million. This represented 10% of the worldwide increase of 175 million. The largest contributors were Turkey (7 million), Malaysia (5 million) and Thailand (4 million).
The countries included in this study account for 88% of the global population—6.2 billion of the total global population of 7 billion in 2011. This means that estimates of numbers of people in this report, e.g., the number who are middle income, likely understate the true count. It is unlikely, however, that proportions, e.g., the share of the global population that is middle income, are affected.↩
See the appendix for the list of countries by region and also for the distributions of people by income in each country within a region.↩
Economic growth in Africa in the past decade is attributed to an increase in the working-age population, rising commodity prices, structural reforms and fewer armed conflicts. See Leke, Lund, Roxburgh and van Wamelen (2010), Cho and Tien (2014) and World Bank (2015).↩
Sosa and Tsounta (2013) and Ferreira, Messina, Rigolini, Lopez-Calva, Lugo and Vakis (2012)↩
References to economic growth in this section are based on trends in GDP per capita in constant prices and in national currencies as published by the International Monetary Fund.↩
More generally, this is the manifestation of a longer-running phenomenon in the U.S.: the decrease in the share of labor in national income (Elsby, Hobjin and Sahin, 2013).↩
In a related vein, Jaumotte (2012) shows that the labor share of national income edged up in advanced economies in Europe from 2000 to 2011 but declined steadily in the U.S.↩
At the same time, much of Europe has lagged behind the U.S. since 2011. The Euro Area experienced negative growth in 2012 and 2013 (International Monetary Fund, 2014), and concerns have arisen about the Russian economy in view of the events in Ukraine, economic sanctions, and declining oil prices.↩
According to the International Monetary Fund, China accounted for 16.3% of global output in 2014, compared with 16.1% for the U.S. In 2011, China accounted for 14.4% and the U.S. accounted for 16.6%. The estimates are based on purchasing power parity-adjusted estimates of GDP.↩
The increase of 126% in median daily per capita in China, as measured from household surveys, may be an understatement. GDP per capita in constant prices and in national currency in China increased 159% from 2001 to 2011, according to data from the International Monetary Fund. Gaps between estimates from national income accounts and household surveys are commonly observed around the world, including in the U.S. The issue is discussed in detail by Deaton (2003), who also notes that the gap is especially large in India. See the methodology appendix for more on this issue.↩
The reference is to GDP per capita in constant 2011 PPP dollars as estimated by the World Bank. Milanovic (2014) contains a broader discussion of trends in Eastern Europe’s transition countries.↩
See the appendix for the detailed distribution of the population by income in each country.↩
An alternate metric might be the change in the middle-income population. This would give weight to countries with bigger populations. For example, the middle-income population increased by 12 million in Indonesia, one of only eight countries in which the middle-income population increased by more than 10 million. But the share of Indonesia’s population that is middle income was only 5% in 2011.↩
Greece is in the grip of a severe economic crisis. According to the World Bank, real final household expenditures per capita in constant national currency in Greece fell at an annual average rate of 4.4% from 2007 to 2013. However, from 2001 to 2011, the period of analysis for this study, real final household expenditures per capita in Greece increased at an annual average rate of 1.3%. This growth likely was sufficient to support a rise in the share of the population in Greece that is upper-middle income from 2001 to 2011.↩