
Updated August 13, 2015: This new edition includes corrected estimates for Iceland, Luxembourg, the Netherlands and Taiwan, and some related aggregated data.
The first decade of this century witnessed an historic reduction in global poverty and a near doubling of the number of people who could be considered middle income. But the emergence of a truly global middle class is still more promise than reality.
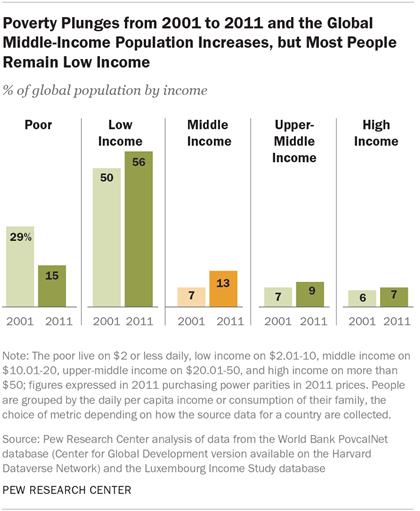
In 2011, a majority of the world’s population (56%) continued to live a low-income existence, compared with just 13% that could be considered middle income by a global standard, according to a new Pew Research Center analysis of the most recently available data.
And though there was growth in the middle-income population from 2001 to 2011, the rise in prosperity was concentrated in certain regions of the globe, namely China, South America and Eastern Europe. The middle class barely expanded in India and Southeast Asia, Africa, and Central America.
Even those newly minted as middle class enjoy a standard of living that is modest by Western norms. As defined in this study, people who are middle income live on $10-20 a day, which translates to an annual income of $14,600 to $29,200 for a family of four. That range merely straddles the official poverty line in the United States—$23,021 for a family of four in 2011.1
Dollar figures estimated for this study are expressed in 2011 prices and are converted to 2011 purchasing power parity dollars. Purchasing power parities (PPPs) are exchange rates adjusted for differences in the prices of goods and services across countries. In principle, one PPP dollar represents the same standard of living across countries. The U.S. serves as the base country for price comparisons and for currency conversions. Thus, for the U.S., one US$ equals one PPP$. But for India, for example, the rupee to US$ conversion rate —46.67 in 2011—is different from the rupee to PPP$ rate—14.975 for individual consumption expenditures by households. Thanks to the lower cost of living in India, this means that only Rs. 14.975, not Rs. 46.67, is needed to obtain what $1 buys in the U.S.
The 2011 PPP estimates used in this study are the latest available benchmark estimates and are based on a round of international price comparisons conducted that year (World Bank, 2014a). Estimates from other sources that are mentioned in this report are typically based on PPPs from 2005, that is, they are derived from a round of international price comparisons conducted in 2005 (World Bank, 2008).
In 2011, only 16% of the world’s population was living on $20 or more daily, a little above the U.S. poverty line. By global standards, that constitutes an upper-middle or high-income existence. And most of these people still lived in the economically advanced countries in North America, Europe and the Asia-Pacific region.
This is not to suggest that developed nations do not struggle with their own issues of income inequality and poverty. But, in a global context, a much greater share of Americans and Europeans are middle or higher income than are people in emerging and developing nations.
Perhaps more importantly from an international perspective, the gap in living standards between the world’s economically advanced countries and emerging and developing nations barely narrowed in the first decade of this century. In 2001, 91% of the world’s high-income people lived in North America and Europe; in 2011, the share was 87%.
These are among the key findings of a study that is one of only a few to analyze change in the world’s middle-income population at the start of the 21st century. The 111 countries covered in the study accounted for 88% of the global population and 85% of world output in 2011. The study is also among the first to make use of the 2011 purchasing power parities (PPPs) that are based on the latest available benchmark estimates of price levels around the world.2 Purchasing power parities are exchange rates corrected for differences in the prices of goods and services across countries and are essential for rendering income data comparable across countries.
[/page-curl]
Who is Middle Income?
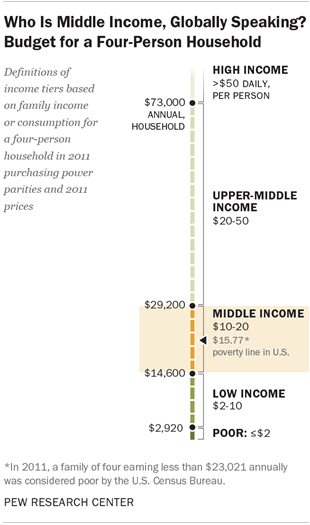
This study divides the population in each country into five groups based on a family’s daily per capita consumption or income.3 The five groups are labeled poor, low income, middle income, upper-middle income, and high income. Of the four thresholds that separate these different income groups, two are especially important to keep in mind. The first is $2, the minimum daily per capita income that must be exceeded to exit poverty.4 The second is $10, the threshold that must be crossed to attain middle-income status. The thresholds are expressed in 2011 prices and 2011 purchasing power parities.
A middle-income threshold of $10 follows a practice that is gaining acceptance among economists. The same, or virtually the same, threshold has been applied by the World Bank (2007, 2015), researchers at the Organization for Economic Cooperation and Development (Kharas, 2010), the development community (Birdsall, 2010; Birdsall, Lustig and Meyer, 2013, and Dadush and Shaw, 2011) and the private sector (Court and Narasimhan, 2010). There is growing consensus that the $10 threshold, which is five times the poverty line used in this study, is associated with economic security and “insulates” people from falling back into poverty.
The terms “middle income” and “middle class” are often used interchangeably. This is especially true among economists who typically define the middle class in terms of income or consumption. But being middle class can connote more than income, be it a college education, white-collar work, economic security, owning a home, or having certain social and political values. Class could also be a state of mind, that is, it could be a matter of self-identification. The interplay among these many factors is examined in studies by Hout (2007) and Savage et al. (2013), among others.
This report uses income or consumption (depending on how data have been collected for a country) to group people. For that reason, the term “middle income” is used more often than not. However, “middle class” is also used, either to describe the overarching issue or to refer to work by other researchers.
The $10 threshold for middle-income status has secured favor in part due to evidence from Latin America. It is estimated that households in Chile, Mexico and Peru have less than a 10% probability of falling into poverty if their per capita income is at least $10 per day.5 Middle-income thresholds were also derived from surveys in five Latin American countries in which people were asked to self-identify their economic class. The threshold fell at about $10 in Colombia, Mexico and Peru, at $16 in Brazil, and at $20 in Chile.6
Coincidentally, the $10 threshold also is close to the median daily per capita income of U.S. households living in poverty ($11.45 in 2011).7 This means that a large share of poor people in the U.S. would also fail to meet the global middle-income standard.
The income thresholds are fixed over time and across countries as they are converted to 2011 prices and expressed in 2011 PPP dollars. Thus, given the fixed $10 middle-income threshold, we can see whether the percentage of the population that is middle income has shrunk, grown or remained the same in different countries over the course of the century’s opening decade. We can also examine shifts in the proportion of the population that is middle income at the regional and global levels.
Are you in the global middle class? Find out with our income calculator
What it Means to Be Poor or Low Income
The $2 poverty line used in this study anticipates that the World Bank’s global standard for extreme poverty, now at $1.25, will move close to $2 when it incorporates 2011 purchasing power parities, rather than the 2005 PPP currently in use (Financial Times, 2014).
More concretely, a poverty line of $2 approximates the ground reality in India. The official poverty line in India currently is about $1.90. In 2014, the India Planning Commission proposed raising the poverty line to $2.46. The proposal is based on actual consumption patterns of Indian families and is deemed sufficient to meet minimum daily calorie requirements. However, at the proposed poverty line, food consumption alone would take up 57% of a rural family’s budget and 47% of an urban family’s budget.
Poverty lines in the developed world are very different, reflecting their higher standards of living. In the U.S., the poverty line in 2011 was $15.77 per day per capita for a household with four people (the precise poverty line varies by household size and composition). The poverty line is defined as the income three times the cost of an economy food plan as determined by the U.S. Department of Agriculture (Orshansky, 1965). In July 2011, the daily per capita cost of the USDA’s thrifty food plan was $5.07 for a family of four with two children ages 6-8 and 9-11 years. This budget allows for meals at home that consist of grains, vegetables, fruits, milk products, meat, beans and other foods, and that meet the U.S. government’s nutrition standards.
The sharp contrast in poverty standards across developing and advanced countries suggests that simply living on more than $2 per day is not necessarily a middle-income standard of living. For instance, people living on $5 per day are still some distance removed from meeting the nutrition standards established in advanced economies and meeting other essential needs. Research also shows a substantial likelihood of falling back into poverty until income approaches a certain level above the poverty threshold.
Why the Middle Matters
Living on $10 a day may not sound like a middle-income existence to someone in the U.S., Germany or Taiwan, but the notion that an individual is on a firm enough footing to not worry about mere subsistence or falling back into extreme poverty is considered by many in business, political and economic circles to matter a great deal.
The size of a country’s middle class depends in part on the extent of inequality. A more equal distribution of income may be associated with a bigger middle-income population. However, the two issues are also distinct for analytical reasons.
This study focuses on the size of the global middle class, that is, the number of people who live on $10 to $20 daily. The middle-income population changes as more or fewer people live within this budget. Note, however, that the average income of this group does not change much over time because it always only includes people living on $10 to $20 daily. The same is true for the lower-income or higher-income groups identified in this study—their populations may change freely, but their incomes are less flexible because they lie within predefined boundaries. This means that the income of one group relative to the income of another group changes little over time.
For studies of inequality, the central concern is to compare the incomes of different groups and how their relative incomes change over time. A typical question might be to compare the income of the poorest 10% of the population with the income of the richest 10%. In this case, the size of the two groups is fixed—each consists of 10% of the population. But their incomes are flexible, free to rise or fall to any level. Global income inequality is studied in detail by Milanovic (1999, 2011) and Lakner and Milanovic (2013), among others.
Dobbs et al. (2012) have hailed the emergence of a new “global consuming class,” people earning $10 or more daily,8 as a phenomenon that has major ramifications for purchasing power and demand-driven growth in numerous developing and emerging markets from now through 2025. Wilson and Dragusanu (2008), too, have commented on the potential for deeper pockets in developing countries to radically alter levels of consumption and open investment opportunities for businesses in the coming decades.
On the political front, the U.S. National Intelligence Council (2012) has described the growth of middle class in the developing world as a “global megatrend” and posited that as people are able to purchase and save more, they will be motivated to push for social and political changes that preserve or advance their long-term interests. More broadly, numerous political scientists have argued that economic equality and opportunity are essential for the existence and stability of democratic institutions.9 And although cause and effect between democracy and growth has proved harder to establish,10 it is worthwhile to note that recent research has found that education and income are strong determinants of the quality of political institutions.11
The importance of the middle class is not limited to developing and emerging markets. In the developed world, economists who have studied whether income inequality is a drag on economic growth have pointed to the potential stimulus that may be provided by a larger middle class. This may happen because lower- and middle-income families are likely to spend greater shares of their incomes on goods and services (Ostry, Berg and Tsangarides, 2014; Summers and Balls, 2015; Dabla-Norris et al., 2015) or because these families have greater incentives to invest in education in more equal societies (Cingano, 2014).
In short, many argue that growth in the middle class, whether in the developing or developed world, can be an economic and political game-changer. The question addressed by this report is whether we have yet to see the emergence of a truly global middle class—one that has the potential to dramatically alter the trajectory of societies around the world.
Middle-Income Numbers on the Rise
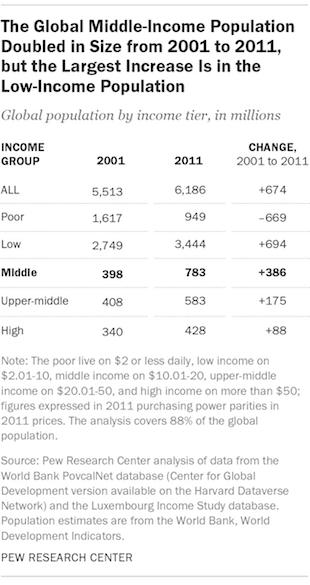
In the 111 countries included in this study, 783 million residents were middle income in 2011, compared with 398 million in 2001. Thus, the middle-income population—those living on $10-20 per day—nearly doubled, increasing by 386 million in the first decade of the new century.
The increase in the middle-income population from 2001 to 2011 was more than twice that for the upper-middle category of $20-50 per day (175 million), and more than four times the increase in the number of high-income people living on more than $50 daily (88 million). Both empirically and analytically, the definition of “middle income” as living on $10-20 per day focuses on what was the principal steppingstone for the majority of people who joined the ranks of the middle class early in this century.
Broader Measures of the Global Middle-Income Population
This study purposefully focuses on a modest income range to define middle-class status, one that is significantly removed from the experience of poverty but does not encompass the highest reaches of the global income distribution. But broader definitions of “middle income” are also possible. For example, one could extend the upper bound of the middle category to $50 per day—closer to what might be considered middle class in the U.S., where the median income in 2011 was $54 per day. Using the definition of $10-50 per day, 1.4 billion people were middle income in 2011, compared with 806 million in 2001. That is a 70% increase in the share of the world’s population that could be considered middle income.12
Other studies of the global middle class use even broader definitions and project swelling numbers in the future. Goldman Sachs defines the middle-income range as $16 to $82 daily and estimates that 1.5 billion people were middle class in 2008. The McKinsey Quarterly, using a range of $9 to $77 daily, pegs the size of the middle class at nearly 2 billion in 2009. Finally, Homi Kharas reports that about 2 billion people were middle class in 2009, based on an income range of $10 to $100 daily.13
If a range of $10 to $100 were used in this study, the size of the middle-income population in 2011 would be 1.7 billion people, or more than double the estimate using the $10-20 per day definition of middle-income status. As alluded to above, however, a broad definition of the global middle class, one that ranges up to $100 per day, obscures the fact that the growth of the middle class was concentrated at the lower end of the income range.
Low-Income Ranks Also Swell
As significant as the rise of the middle class has been, middle-incomes status is still beyond the grasp of many people in developing and emerging markets. Though poverty plunged in historic fashion from 2001 to 2011, it did as much to swell the ranks of low-income earners as to boost the ranks of the middle class.14 The majority of the world’s population remains low income.
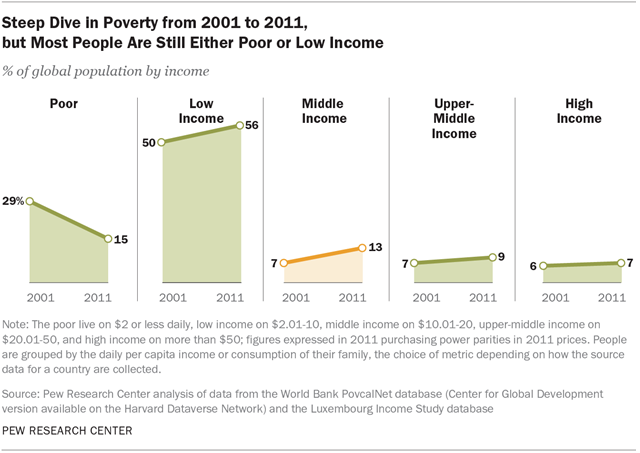
A review of the changing sizes of different income groups brings this point home. From 2001 to 2011, the share of the world’s population that subsisted on $2 or less per day halved from 29% to 15%. At the same time, the share of people classified as low income ($2-10 per day) increased from 50% of the world’s population to 56%. That 6 percentage point increase, in turn, was matched by a similar increase in the share of the world’s population that could be considered middle income (5 percentage points). Meanwhile, the share of the world’s population in higher-income categories barely changed between 2001 and 2011: Those who are upper-middle income increased from 7% to 9% of the global population, and high-income earners ticked up from 6% to 7%.
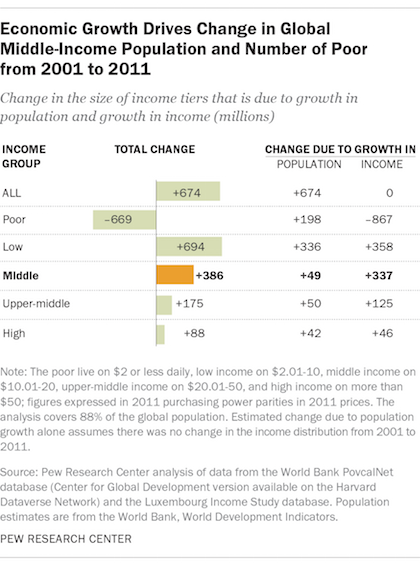
Shifting from percent shares to absolute numbers, the scale of poverty’s plunge and the expansion of the global low-income population—and the reasons behind each—come into clearer focus. From 2001 to 2011, 669 million people moved out of poverty. All of this decline, and more, was due to improved living standards. If there had been no change in the income distribution from 2001 to 2011,15 population growth alone would have raised the number of people who are poor by 198 million. In actual fact, however, the number of poor people did not increase by 198 million, it decreased by 669 million. This means that economic growth, by generally raising incomes and pushing people up the ladder, worked to eliminate poverty for 867 million people in the 2000s.
The total increase in the low-income population from 2001 to 2011—694 million—is slightly greater than the decrease in the number of the poor population. Population growth and economic growth are estimated to have worked in almost equal parts to raise the low-income population, by 336 million and 358 million, respectively.
The increase in the middle-income population from 2001 to 2011 is 386 million, a little more than half as much as the increase in the low-income population. But the increase in the middle-income population was almost entirely due to economic growth, as rising incomes added 337 million people to the middle class, compared with the addition of 49 million due to population growth.
In sum, the share of the world’s population living a low-income existence and the share living a middle-income existence increased similarly (6 percentage points and 5 points, respectively) from 2001 to 2011. When we consider the number of people who entered each category due to improved living standards, the expansion of the low-income tier slightly outpaces the growth of the middle-income tier (358 million vs. 337 million). But when all sources of change are accounted for, the increase in the low-income population exceeds the increase in the middle-income population by nearly two-to-one (694 million vs. 386 million).
While the doubling of the global middle class, from 7% in 2001 to 13% in 2011, is certainly a major shift with potentially major economic and political ramifications, it is important to keep in mind that, at the end of the first decade of the 21st century, the vast majority of the world’s population (71%) remained either poor or low income.
The Distribution of the Global Population by Income: A More Detailed Picture
This report analyzes changes in the distribution of the world’s population by income, using five income brackets or categories: poor, low income, middle income, upper-middle income and high income. These categories capture the key shifts in the global population by income levels between 2001 and 2011. But the distribution of the world’s population varies not only across but also within these income categories.
For the chart below, the global population was divided into 200 groups with incomes ranging from $0-1, $1-2, $2-3, and so on up to a maximum of $199 or greater per capita per day. The height of a bar depicts the percentage of the global population that earns (or consumes) a given amount daily. The chart does not depict income intervals beyond $50 because of the small shares of the global population that live on those budgets.
In 2001, 23% of people worldwide lived on $1-2 per day. This is also the highest bar of the histogram, meaning a daily income of $1-2 was the most prevalent standard of living in the world in 2001. Very few people lived on more than $10 per day. Indeed, the shares of the global population with incomes greater than $20 per day are virtually undetectable.
There are clear signs of improvement in the income distribution from 2001 to 2011 as the share of the global population living on $3 or less per day fell significantly. In 2011, the most common standard of living was $2-3 per day, with 16% of the global population at that level. It can also be seen that greater shares of the global population were living on more than $3 per day in 2011 than in 2001 (represented by the upward shift in the histogram at income levels greater than $3 per day).
However, the chart also makes clear that while the number of poor people plunged in the opening decade of the 21st century, most low-income earners in 2011 lived closer to the poverty line ($2 per day) than the threshold for middle-income status ($10 per day). Indeed, in both 2001 and 2011, living on either $1-2 or $2-3 per day was the most probable outcome, globally speaking. Overall, in both years, the vast majority of people live on less than $10 per day.
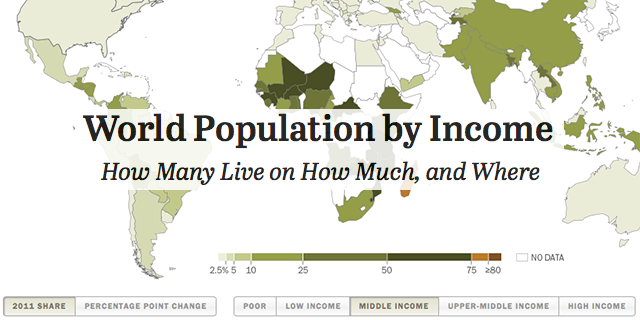
How Many Live on How Much?
The Uneven Geography of the Emerging Middle Class
In addition to middle-income earners remaining a relatively small portion of the world’s population, the growth in the middle class has been concentrated in particular regions. In particular, China, South America and Eastern Europe are home to some of the biggest increases in middle-income populations. By contrast, Africa and much of Asia, including India, have lagged behind.
The story of China is remarkable. Three decades after the introduction of economic reforms in 1978, the share of China’s population that is middle income stood at 18% in 2011—up by 15 percentage points from 3% in 2001. In absolute terms, 203 million people in China crossed the middle-income threshold of $10 per day from 2001 to 2011.
Eastern Europe, too, witnessed a significant expansion of the middle-income population. The region experienced significant economic contractions after the fall of the Berlin Wall in 1989, but many nations reclaimed economic ground in the first decade of this century.16 Examples from the region include Belarus, where the share that is middle income rose from 21% in 2001 to 53% in 2011, and Romania, where the share increased from 6% to 25% over the same period.17 In the region overall, the middle-income population increased by 39 million.
Countries in South America and Mexico also led the way in expanding their middle-income populations. From 2001 to 2011, some 63 million people in these countries crossed the $10 per day threshold. Booming commodity prices and income redistribution policies contributed to rising incomes in a number of South American countries. Argentina, Ecuador, Peru and Brazil all had double-digit increases in the percentage of their populations living a middle-income existence.
In contrast to China, most other Asian countries had relatively little growth in their middle classes. India is a case in point. Although the poverty rate in India fell from 35% in 2001 to 20% in 2011, the share of the Indian population that could be considered middle income increased from 1% to just 3%. Instead of a burgeoning middle class, India’s ranks of low-income earners swelled. Many of these were people hovering closer to $2 than $10 in daily income, and thus still a ways from the transition to middle-income status.
African countries experienced some of the most dramatic declines in poverty rates from 2001 to 2011; however, few countries had much of an increase in the share of middle-income earners. Similar to India, most of the movement was from poverty to low-income status. Ethiopia, for example, experienced a decline of 27 percentage points in the share of people who could be considered poor. This translated into an increase of 26 percentage points in the country’s share of low-income earners and only a 1-point increase in middle-income earners. In Nigeria, one of the region’s most dynamic economies, the share of the poor fell 18 percentage points from 2001 to 2011, resulting in a 17 percentage point increase in low-income earners and just a 1-point boost in the share of the population that could be considered middle income.
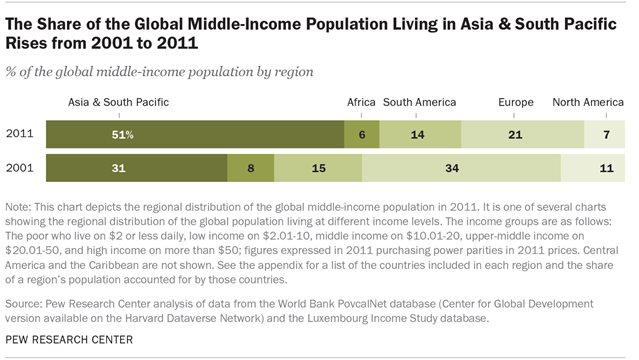
At a global scale, China’s economic trajectory over the course of the century’s first decade looms large. Home to more than 1.3 billion people, or nearly 20% of the world’s population, China alone accounted for more than one-in-two additions to the global middle-income population from 2001 to 2011. The result was a pivot to the east, with the share of the world’s middle-income population residing in Asia & South Pacific increasing from 31% in 2001 to 51% in 2011.18
High-Income Populations Still Clustered in Economically Advanced Nations
Advanced economies in Europe and North America are home to most of the world’s upper-middle income and high-income populations. The gap between them and the rest of the world on this score narrowed only slightly from 2001 to 2011, despite the booming Chinese economy.
In 2001, 75% of the global population that was upper-middle income, those living on $20 to $50 daily, lived in Europe and North America. By 2011, the share living in Europe and North America fell to 63%. The regions gaining shares were Asia & South Pacific—up from 14% in 2001 to 23% in 2011—and South America, which was up from 8% to 10%. China alone raised its share of the global upper-middle income population from 1% in 2001 to 10% in 2011.19
But Europe and North America continue to dominate the top rung of the income ladder. Some 87% of the global high-income population, with $50 or more at their disposal daily, lived there in 2011, compared with 91% in 2001. Within this group, Western Europe gained on the U.S. with respect to the shares of their populations that are high income. Among the countries included in this study, several had higher shares of their populations living on more than $50 per day in 2011 than the U.S.20 In order, they are Norway, Luxembourg, Denmark, the Netherlands, Iceland, Germany, Finland and Canada. Of this group, all but Denmark, Germany and Luxembourg lagged behind the U.S. on this front in 2001.
Globally, there was little change in the share of people living at the higher ends of the income scale. As noted, only 16% of the global population lived on more than the middle-income level in 2011, up slightly from 14% in 2001. This comprises the 9% of the global population that was upper-middle income in 2011 and the 7% that was high income. Thus, stepping over the $20 daily threshold is still beyond the means of most of the global population.
At the same time, many people in advanced economies live on incomes above this threshold. In the U.S., for example, the median daily per capita income was $56 in 2011 and 88% of the population lived on more than $20 per day.21 A similar scenario unfolds in other advanced economies, underscoring the vast economic gulf that separates them from the rest of the world.
Road Map to the Report
The analysis in this report encompasses 111 countries with a combined population of 6.2 billion in 2011, or 88% of the global population. These countries also accounted for 85% of global output in 2011. Thus, estimates of the distribution of the global population by income are unlikely to change with the inclusion of more countries. Meanwhile, counts of people—such as how many are middle income—are slightly underestimated.
Estimates are presented for the world and for the major regions, such as Asia & South Pacific, Africa, and Europe. The report also highlights trends in selected major countries, such as in China and India; trends in the U.S. and for its partners in Western Europe; and developments in Eastern Europe.
The dates chosen for the analysis are predicated on the availability of data. The end point is 2011 because more recent data are scarcely available. Also, the latest benchmark estimates of purchasing power parities—exchange rates corrected for differences in the prices of goods and services across countries—are for 2011. This is one of the first studies to make use of the 2011 parities, which represent a step forward in methodology and the latest understanding of how the cost of living compares across countries.22 The starting point, 2001, is one decade earlier and marks the beginning of the century.
Data for 90 of the 111 countries included in the report come from the World Bank’s PovcalNet database. A simpler, user-friendly version of these data was provided by the Center for Global Development (see the appendix for details).23 For most countries, data in PovcalNet represent consumption levels. The major exception is South American countries, which feature data on income. Data for the 21 remaining countries are derived from the Luxembourg Income Study database. These countries all provide data on household income.
Overall, the 111 countries in the study were selected on the basis of the availability of data for dates at or around 2001 and 2011. Data for exactly those two years were not available for most countries, however. Thus, estimates of the population distributions by income for those dates are typically the results of projections of survey data from years close to 2001 and 2011. The estimates are also subject to limitations that may be present in the source data. The appendix describes the methodology in detail and also notes the major limitations of the data.
The remainder of the report is organized as follows: The next section presents in text, charts and maps estimates of the distribution of the global population by income in 2001 and 2011, and also of the distributions in the major regions of the world. Subsequent sections highlight trends in individual countries and areas experiencing growth in middle-income populations, such as China and countries in Eastern Europe and Latin America; changes in India and other countries, such as in Africa, that experienced declines in poverty but minimal change in their middle-income populations; and trends in advanced economies, such as the U.S. and countries in Western Europe, which generally held on to their economic advantage over most of the rest of the world.


