
After soaring in 2018 compared with the previous midterm, voter turnout in the 2022 midterm elections for the U.S. House of Representatives fell back to, if not Earth, then at least the lower atmosphere.
Nationwide, nearly 107.7 million valid votes were cast in the 2022 House elections, representing about 45.1% of the estimated voting-eligible population, according to a Pew Research Center analysis of official returns from all 50 states. That was down from 48.1% turnout in 2018 – when midterm voting reached levels not seen in more than a century – but still higher than the 34.4% turnout rate for House elections in the 2014 midterms.
In the run-up to the 2022 midterm elections, many political observers wondered whether the turnout surge seen in 2018 (compared with the previous midterms in 2014) and the even higher turnout rates of 2020 would, or even could, be sustained, particularly given many (but not all) states’ move toward more restrictive voting policies. Pew Research Center conducted this analysis to assess how turnout actually changed in 2022 compared with prior elections.
We used votes cast in House elections for this analysis because, unlike elections for senator or governor, they occur in every state every two years, allowing for more direct turnout comparisons over time. Still, House turnout rates aren’t a perfect measure, since not every House district is equally competitive every election cycle, and not all contests necessarily feature two major-party candidates. Other turnout analyses, like the United States Election Project, have used different metrics, such as the vote for the highest office on each state’s ballot. Even so, those analyses generally show similar patterns as our own.
Preliminary vote counts often are available within a day or two after Election Day. In many states, however, absentee and provisional ballots can trickle in for several days after Election Day, and it can take weeks or even months for the results to be certified, particularly when there are recounts or legal challenges in specific races. Kentucky was the last state to formally certify its 2022 results, posting them online in mid-February 2023.
For this analysis, we used official vote totals obtained from each state’s central elections authority, by congressional district, for the past six House elections. The sum of all valid votes cast in all House elections – including write-ins, when applicable – became the numerator in our turnout calculation. For the denominator, we used the state-level “voting-eligible population” (VEP) estimates produced by the United States Election Project, a long-running endeavor by University of Florida political scientist Michael McDonald. We limited the analysis to voting House members, meaning that the District of Columbia, Puerto Rico and U.S. territories were excluded.
The Census Bureau’s estimates of the “citizen voting-age population” (CVAP) are also frequently used as the denominator in turnout calculations. But as of publication, CVAP data for 2022 wasn’t yet available. A comparison of prior years’ turnout rates calculated using VEP and CVAP found them generally to be fairly similar.
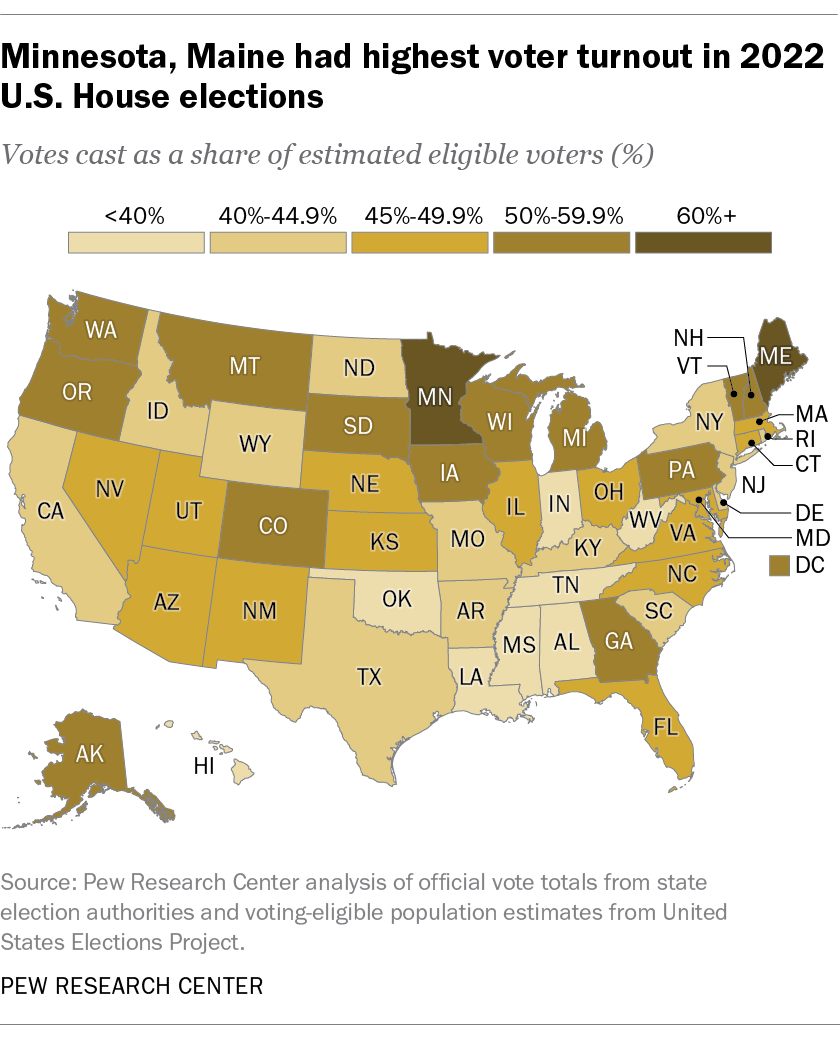
Minnesota and Maine, two states that frequently have led the nation in voter turnout for House elections, also topped the table in 2022, with turnout in each reaching about 60% of eligible voters. At the bottom were Louisiana, Mississippi and Tennessee, where only about a third of eligible voters cast ballots for the House.
Voter turnout for the 2022 House races was below 2018 turnout in all but eight states. In Michigan and New Hampshire, total turnout in 2022 was 2.4 percentage points higher than in 2018. Turnout in Pennsylvania was 1.9 points higher, and in Maine it was up 1.5 points. (Hawaii, Florida, Oregon and Arkansas showed smaller increases.) Most of those top-turnout states featured hotly contested elections for governor, senator or both, which may have boosted the number of people who also voted in House races and other down-ballot contests.
Midterm turnout in 2022 fell off the most in North Dakota, where Republican incumbent Rep. Kelly Armstrong, the state’s lone House member, faced independent Cara Mund. About 42% of eligible North Dakotans voted in that race, down from roughly 57% in 2018.
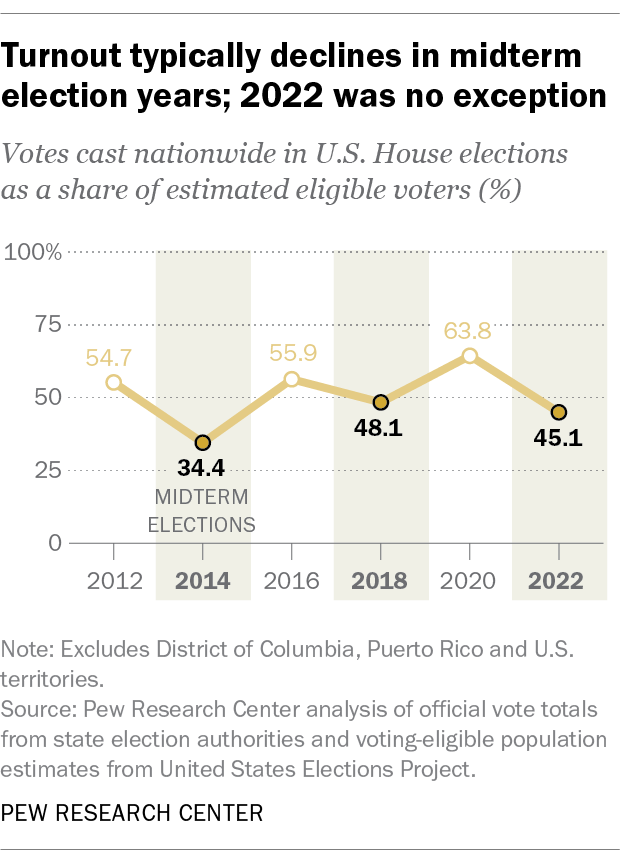
Turnout in House elections generally is lower in midterm years than in presidential election years, a phenomenon that’s been observed for decades. But within that broad and persistent pattern, there can be many reasons why turnout in any given state’s House races might fluctuate from one year to another. For one thing, competition matters: Hotly contested races (for the House itself or for higher-profile offices elsewhere on the ballot) can drive up turnout, while uncontested or uncompetitive ones can depress it.
In 2022, 35 House seats, or 8% of the total, were noncompetitive or, at best, lightly competitive between parties, meaning that only one major party was represented on the ballot. (Republicans won 23 of those seats and Democrats won 12.) In 16 of these districts only one candidate was listed on the ballot, with opposition – if any – limited to write-in candidates. In 13 additional districts, a single major-party candidate faced only minor-party or independent opposition. And in six California districts, the November election was between two Democrats, due to that state’s “top two” primary system.
Different voting rules also may help explain why turnout varies between states, and within the same state, from year to year. Some states, such as California, Washington and Oregon, run all-mail elections that make voting more convenient or have extensive early- and absentee-voting systems, while other states do not.
In 2021 and 2022, several states pulled back from changes they adopted in 2020 during the COVID-19 pandemic to make voting easier and more accessible, or introduced new voting restrictions entirely. However, there doesn’t appear to be any clear relationship between the relative difficulty of voting in states and their overall 2022 turnout rates, nor in their drop-offs between 2020 and 2022.
