
Many public K-12 schools in the United States have taken steps in recent years to tighten security, including outfitting classroom doors with interior locks, drafting active shooter preparedness plans and hiring sworn law enforcement officers to patrol buildings, according to recently released data from the National Center for Education Statistics (NCES). Still, school security protocols vary widely by type of school, geography and other factors.
The new data comes amid heightened attention to school security after a deadly shooting at an elementary school in Uvalde, Texas, in May. In the wake of the Uvalde shooting, here is a look at some of the most common school security measures and how the K-12 security landscape has changed in recent years.
This analysis relies on data collected by the federal government to assess the security measures that public K-12 schools in the United States have employed in recent years, as well as how the adoption of these protocols varies by type of school, region and other factors. The analysis draws on nearly two decades of survey data from the School Survey on Crime and Safety by the National Center for Education Statistics (NCES). The most recent data available for U.S. public schools is from the 2019-20 school year and includes responses from both traditional public schools and charter schools.
More information on the survey’s methodology can be found in the NCES report.
Building security
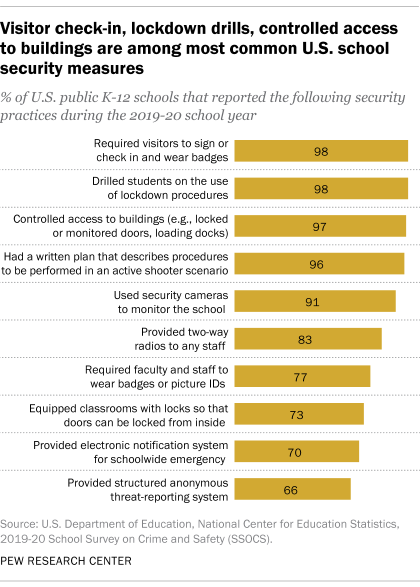
The vast majority of U.S. public K-12 schools (including traditional public schools and charter schools) reported taking steps to physically secure buildings and classrooms during the 2019-20 school year, the most recent year for which data is available. Almost all schools restricted entry by controlling access to buildings during school hours with measures such as locked or monitored doors and loading docks (97%), or by requiring visitors to sign or check in and wear a badge (98%). Around three-quarters (73%) had classrooms equipped with locks so that doors can be locked from inside.
Restricting access to school buildings was pervasive across schools of all types. Nine-in-ten or more schools took this action, regardless of grade level, location, enrollment or student characteristics.
Classrooms are less likely to have locking doors in schools where greater shares of students come from households with lower incomes. One proxy measure of household income level is the share of students who qualify for free or reduced-price lunch. Among schools where at least three-quarters of students qualify for this program, 69% had locking doors in their classrooms in the 2019-20 school year, compared with 78% at schools where a quarter or fewer students qualify for free or reduced-price lunch.
Charter schools were 11 percentage points more likely than traditional public schools to have doors that lock from the inside in the 2019-20 school year (83% vs. 72%).
Active shooter response
Procedures to respond to threats are also prevalent across public schools. In 2019-20, 96% of all public K-12 schools had a written plan describing procedures to be performed in an active shooter situation, and 98% had conducted a lockdown drill with students that year. Lockdown procedures involve securing school buildings and grounds during incidents that pose an immediate threat of violence in or around the school.
The share of schools with written plans for an active shooter situation has increased from 79% in 2003-04, the earliest data available. (The NCES survey that year described active shooter scenarios as “shootings”; the 2019-20 data specifically referred to “active shooter” situations with “one or more individuals actively engaged in killing or attempting to kill people in a populated area.”)
Safety-related communications and technology
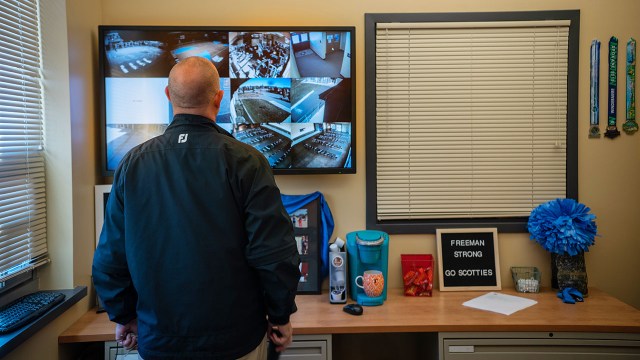
Many public schools used some form of security-related communication system or technology during the 2019-20 school year. The majority reported using security cameras to monitor the school (91%) or providing two-way radios to any staff (83%). Seven-in-ten schools provided an electronic notification system that automatically notifies parents in case of a school-wide emergency, and 66% provided a structured, anonymous threat-reporting system, such as an online submission form, telephone hotline or written submission form via drop box.
The share of schools with each of these communication systems and technologies has increased over the last decade. For example, the proportion of schools that have an anonymous threat-reporting system has nearly doubled since the 2009-10 school year, when 36% gave students this option. There has been a 30-point increase in the use of security cameras to monitor schools, up from 61% in 2009-10.
Though not as common as other measures, 40% of schools had “panic buttons” or silent alarms directly connected to law enforcement in 2019-20. That is an increase from 2015-16 (27%), the earliest data available.
There are some differences in adoption of these systems based on the school’s characteristics and the region of the country where it is located. In the 2019-20 school year, middle and high schools were more likely than elementary schools to have anonymous threat-reporting systems (77% of middle schools and 76% of high schools, vs. 59% of elementary schools) and security cameras (94% of middle schools and 97% of high schools, vs. 88% of elementary schools). Schools with greater shares of students who are racial and ethnic minorities were also more likely to use threat-reporting systems, and less likely to report using security cameras.
Panic buttons were more common in schools where relatively few students qualify for free or reduced-price lunch. For example, roughly half of schools (53%) where 25% of students or fewer qualify for free or reduced-price lunch programs used this technology, compared with around a third of schools (35%) where three-quarters of students or more qualified for the program.
Regionally, about three-quarters of schools in the West (76%) reported using security cameras in 2019-20, compared with more than nine-in-ten in the Northeast (93%), Midwest (95%) and South (98%). And around a quarter of schools in the West (27%) had installed panic buttons, compared with 43% each in the Midwest and South and about half of schools in the Northeast (49%).
Schools with higher enrollment are more likely than smaller ones to have each of the communications and technology measures asked about.
Security staff
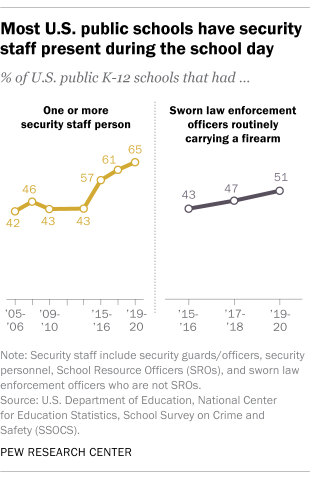
About two-thirds of public K-12 schools (65%) had one or more security staff person present at the school at least once a week in 2019-20, up from 43% a decade earlier. In about half of schools (51%) in the 2019-20 school year, the security staff included at least one sworn law enforcement officer who routinely carried a firearm. In the 2009-10 school year, 28% of public schools reported having any security staff member who routinely carried a firearm.
Security staff presence varies somewhat based on certain school characteristics. For instance, security staffers are more common at larger schools: 96% of schools with 1,000 or more students reported having one or more security staff person in 2019-20, compared with about half (48%) of schools with fewer than 300 students. More than eight-in-ten middle (82%) and high schools (84%) had security staff in the 2019-20 school year, compared with 55% of elementary schools.
There are similar patterns when it comes to whether the school’s security staff includes officers who carry firearms, but with a notable difference: Schools where more than three-quarters of the students are racial or ethnic minorities are the least likely to have an officer who carries a firearm (43% of these schools fall into that category, compared with 57% of schools where a quarter of students or fewer are minorities).
Threat assessment teams
During the 2019-20 school year, about two-thirds of schools (64%) reported having a threat assessment team in place. Threat assessment in this NCES survey was defined as “a formalized process of identifying, assessing and managing students who may pose a threat of targeted violence in schools.” A threat assessment team typically includes school staff such as administrators and school psychologists.
Again, certain types of schools were more likely to take this precaution. Schools in cities (67%) and suburbs (71%) more often had a threat assessment team than those in rural areas (56%). Threat assessment teams were also more common at the middle and high school level, at schools with higher enrollment numbers and at schools with a larger proportion of students who are racial or ethnic minorities.
