Confidence in U.S. public opinion polling was shaken by errors in 2016 and 2020. In both years’ general elections, many polls underestimated the strength of Republican candidates, including Donald Trump. These errors laid bare some real limitations of polling.
In the midterms that followed those elections, polling performed better. But many Americans remain skeptical that it can paint an accurate portrait of the public’s political preferences.
Restoring people’s confidence in polling is an important goal, because robust and independent public polling has a critical role to play in a democratic society. It gathers and publishes information about the well-being of the public and about citizens’ views on major issues. And it provides an important counterweight to people in power, or those seeking power, when they make claims about “what the people want.”
The challenges facing polling are undeniable. In addition to the longstanding issues of rising nonresponse and cost, summer 2024 brought extraordinary events that transformed the presidential race. The good news is that people with deep knowledge of polling are working hard to fix the problems exposed in 2016 and 2020, experimenting with more data sources and interview approaches than ever before. Still, polls are more useful to the public if people have realistic expectations about what surveys can do well – and what they cannot.
With that in mind, here are some key points to know about polling heading into this year’s presidential election.
Probability sampling (or “random sampling”). This refers to a polling method in which survey participants are recruited using random sampling from a database or list that includes nearly everyone in the population. The pollster selects the sample. The survey is not open for anyone who wants to sign up.
Online opt-in polling (or “nonprobability sampling”). These polls are recruited using a variety of methods that are sometimes referred to as “convenience sampling.” Respondents come from a variety of online sources such as ads on social media or search engines, websites offering rewards in exchange for survey participation, or self-enrollment. Unlike surveys with probability samples, people can volunteer to participate in opt-in surveys.
Nonresponse and nonresponse bias. Nonresponse is when someone sampled for a survey does not participate. Nonresponse bias occurs when the pattern of nonresponse leads to error in a poll estimate. For example, college graduates are more likely than those without a degree to participate in surveys, leading to the potential that the share of college graduates in the resulting sample will be too high.
Mode of interview. This refers to the format in which respondents are presented with and respond to survey questions. The most common modes are online, live telephone, text message and paper. Some polls use more than one mode.
Weighting. This is a statistical procedure pollsters perform to make their survey align with the broader population on key characteristics like age, race, etc. For example, if a survey has too many college graduates compared with their share in the population, people without a college degree are “weighted up” to match the proper share.
How are election polls being conducted?
Pollsters are making changes in response to the problems in previous elections. As a result, polling is different today than in 2016. Most U.S. polling organizations that conducted and publicly released national surveys in both 2016 and 2022 (61%) used methods in 2022 that differed from what they used in 2016. And change has continued since 2022.
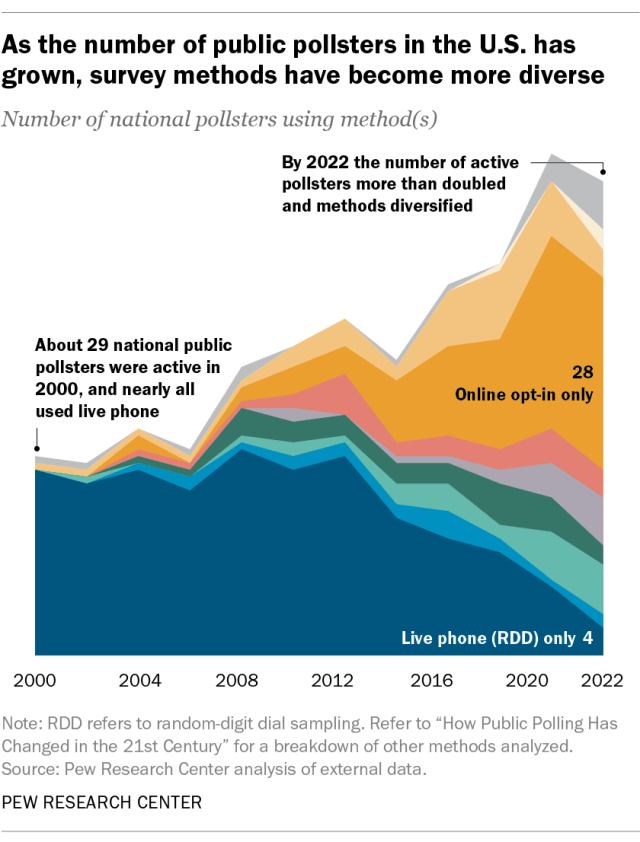
One change is that the number of active polling organizations has grown significantly, indicating that there are fewer barriers to entry into the polling field. The number of organizations that conduct national election polls more than doubled between 2000 and 2022.
This growth has been driven largely by pollsters using inexpensive opt-in sampling methods. But previous Pew Research Center analyses have demonstrated how surveys that use nonprobability sampling may have errors twice as large, on average, as those that use probability sampling.
The second change is that many of the more prominent polling organizations that use probability sampling – including Pew Research Center – have shifted from conducting polls primarily by telephone to using online methods, or some combination of online, mail and telephone. The result is that polling methodologies are far more diverse now than in the past.
(For more about how public opinion polling works, including a chapter on election polls, read our short online course on public opinion polling basics.)
All good polling relies on statistical adjustment called “weighting,” which makes sure that the survey sample aligns with the broader population on key characteristics. Historically, public opinion researchers have adjusted their data using a core set of demographic variables to correct imbalances between the survey sample and the population.
But there is a growing realization among survey researchers that weighting a poll on just a few variables like age, race and gender is insufficient for getting accurate results. Some groups of people – such as older adults and college graduates – are more likely to take surveys, which can lead to errors that are too sizable for a simple three- or four-variable adjustment to work well. Adjusting on more variables produces more accurate results, according to Center studies in 2016 and 2018.
A number of pollsters have taken this lesson to heart. For example, recent high-quality polls by Gallup and The New York Times/Siena College adjusted on eight and 12 variables, respectively. Our own polls typically adjust on 12 variables. In a perfect world, it wouldn’t be necessary to have that much intervention by the pollster. But the real world of survey research is not perfect.
Predicting who will vote is critical – and difficult. Preelection polls face one crucial challenge that routine opinion polls do not: determining who of the people surveyed will actually cast a ballot.
Roughly a third of eligible Americans do not vote in presidential elections, despite the enormous attention paid to these contests. Determining who will abstain is difficult because people can’t perfectly predict their future behavior – and because many people feel social pressure to say they’ll vote even if it’s unlikely.
No one knows the profile of voters ahead of Election Day. We can’t know for sure whether young people will turn out in greater numbers than usual, or whether key racial or ethnic groups will do so. This means pollsters are left to make educated guesses about turnout, often using a mix of historical data and current measures of voting enthusiasm. This is very different from routine opinion polls, which mostly do not ask about people’s future intentions.
When major news breaks, a poll’s timing can matter. Public opinion on most issues is remarkably stable, so you don’t necessarily need a recent poll about an issue to get a sense of what people think about it. But dramatic events can and do change public opinion, especially when people are first learning about a new topic. For example, polls this summer saw notable changes in voter attitudes following Joe Biden’s withdrawal from the presidential race. Polls taken immediately after a major event may pick up a shift in public opinion, but those shifts are sometimes short-lived. Polls fielded weeks or months later are what allow us to see whether an event has had a long-term impact on the public’s psyche.
How accurate are polls?
The answer to this question depends on what you want polls to do. Polls are used for all kinds of purposes in addition to showing who’s ahead and who’s behind in a campaign. Fair or not, however, the accuracy of election polling is usually judged by how closely the polls matched the outcome of the election.
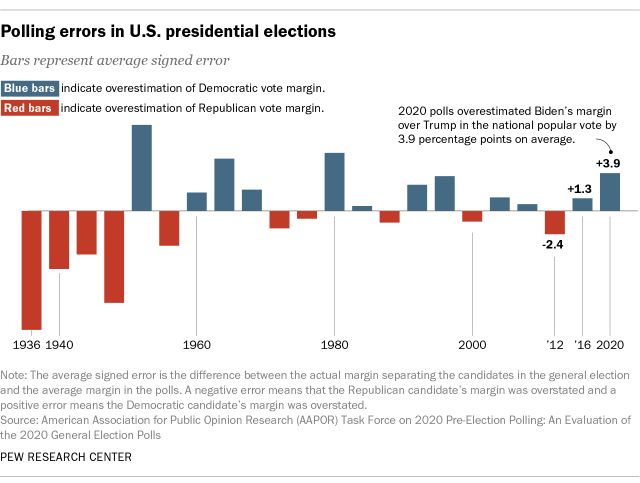
By this standard, polling in 2016 and 2020 performed poorly. In both years, state polling was characterized by serious errors. National polling did reasonably well in 2016 but faltered in 2020.
In 2020, a post-election review of polling by the American Association for Public Opinion Research (AAPOR) found that “the 2020 polls featured polling error of an unusual magnitude: It was the highest in 40 years for the national popular vote and the highest in at least 20 years for state-level estimates of the vote in presidential, senatorial, and gubernatorial contests.”
How big were the errors? Polls conducted in the last two weeks before the election suggested that Biden’s margin over Trump was nearly twice as large as it ended up being in the final national vote tally.
Errors of this size make it difficult to be confident about who is leading if the election is closely contested, as many U.S. elections are.
Pollsters are rightly working to improve the accuracy of their polls. But even an error of 4 or 5 percentage points isn’t too concerning if the purpose of the poll is to describe whether the public has favorable or unfavorable opinions about candidates, or to show which issues matter to which voters. And on questions that gauge where people stand on issues, we usually want to know broadly where the public stands. We don’t necessarily need to know the precise share of Americans who say, for example, that climate change is mostly caused by human activity. Even judged by its performance in recent elections, polling can still provide a faithful picture of public sentiment on the important issues of the day.
The 2022 midterms saw generally accurate polling, despite a wave of partisan polls predicting a broad Republican victory. In fact, FiveThirtyEight found that “polls were more accurate in 2022 than in any cycle since at least 1998, with almost no bias toward either party.” Moreover, a handful of contrarian polls that predicted a 2022 “red wave” largely washed out when the votes were tallied. In sum, if we focus on polling in the most recent national election, there’s plenty of reason to be encouraged.
Compared with other elections in the past 20 years, polls have been less accurate when Donald Trump is on the ballot. Preelection surveys suffered from large errors – especially at the state level – in 2016 and 2020, when Trump was standing for election. But they performed reasonably well in the 2018 and 2022 midterms, when he was not.
During the 2016 campaign, observers speculated about the possibility that Trump supporters might be less willing to express their support to a pollster – a phenomenon sometimes described as the “shy Trump effect.” But a committee of polling experts evaluated five different tests of the “shy Trump” theory and turned up little to no evidence for each one. Later, Pew Research Center and, in a separate test, a researcher from Yale also found little to no evidence in support of the claim.
Instead, two other explanations are more likely. One is about the difficulty of estimating who will turn out to vote. Research has found that Trump is popular among people who tend to sit out midterms but turn out for him in presidential election years. Since pollsters often use past turnout to predict who will vote, it can be difficult to anticipate when irregular voters will actually show up.
The other explanation is that Republicans in the Trump era have become a little less likely than Democrats to participate in polls. Pollsters call this “partisan nonresponse bias.” Surprisingly, polls historically have not shown any particular pattern of favoring one side or the other. The errors that favored Democratic candidates in the past eight years may be a result of the growth of political polarization, along with declining trust among conservatives in news organizations and other institutions that conduct polls.
Whatever the cause, the fact that Trump is again the nominee of the Republican Party means that pollsters must be especially careful to make sure all segments of the population are properly represented in surveys.
The real margin of error is often about double the one reported. A typical election poll sample of about 1,000 people has a margin of sampling error that’s about plus or minus 3 percentage points. That number expresses the uncertainty that results from taking a sample of the population rather than interviewing everyone. Random samples are likely to differ a little from the population just by chance, in the same way that the quality of your hand in a card game varies from one deal to the next.
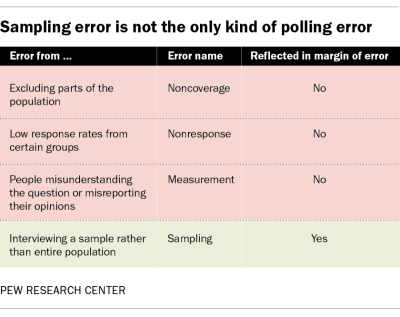
The problem is that sampling error is not the only kind of error that affects a poll. Those other kinds of error, in fact, can be as large or larger than sampling error. Consequently, the reported margin of error can lead people to think that polls are more accurate than they really are.
There are three other, equally important sources of error in polling: noncoverage error, where not all the target population has a chance of being sampled; nonresponse error, where certain groups of people may be less likely to participate; and measurement error, where people may not properly understand the questions or misreport their opinions. Not only does the margin of error fail to account for those other sources of potential error, putting a number only on sampling error implies to the public that other kinds of error do not exist.
Several recent studies show that the average total error in a poll estimate may be closer to twice as large as that implied by a typical margin of sampling error. This hidden error underscores the fact that polls may not be precise enough to call the winner in a close election.
Other important things to remember
Transparency in how a poll was conducted is associated with better accuracy. The polling industry has several platforms and initiatives aimed at promoting transparency in survey methodology. These include AAPOR’s transparency initiative and the Roper Center archive. Polling organizations that participate in these organizations have less error, on average, than those that don’t participate, an analysis by FiveThirtyEight found.
Participation in these transparency efforts does not guarantee that a poll is rigorous, but it is undoubtedly a positive signal. Transparency in polling means disclosing essential information, including the poll’s sponsor, the data collection firm, where and how participants were selected, modes of interview, field dates, sample size, question wording, and weighting procedures.
There is evidence that when the public is told that a candidate is extremely likely to win, some people may be less likely to vote. Following the 2016 election, many people wondered whether the pervasive forecasts that seemed to all but guarantee a Hillary Clinton victory – two modelers put her chances at 99% – led some would-be voters to conclude that the race was effectively over and that their vote would not make a difference. There is scientific research to back up that claim: A team of researchers found experimental evidence that when people have high confidence that one candidate will win, they are less likely to vote. This helps explain why some polling analysts say elections should be covered using traditional polling estimates and margins of error rather than speculative win probabilities (also known as “probabilistic forecasts”).
National polls tell us what the entire public thinks about the presidential candidates, but the outcome of the election is determined state by state in the Electoral College. The 2000 and 2016 presidential elections demonstrated a difficult truth: The candidate with the largest share of support among all voters in the United States sometimes loses the election. In those two elections, the national popular vote winners (Al Gore and Hillary Clinton) lost the election in the Electoral College (to George W. Bush and Donald Trump). In recent years, analysts have shown that Republican candidates do somewhat better in the Electoral College than in the popular vote because every state gets three electoral votes regardless of population – and many less-populated states are rural and more Republican.
For some, this raises the question: What is the use of national polls if they don’t tell us who is likely to win the presidency? In fact, national polls try to gauge the opinions of all Americans, regardless of whether they live in a battleground state like Pennsylvania, a reliably red state like Idaho or a reliably blue state like Rhode Island. In short, national polls tell us what the entire citizenry is thinking. Polls that focus only on the competitive states run the risk of giving too little attention to the needs and views of the vast majority of Americans who live in uncompetitive states – about 80%.
Fortunately, this is not how most pollsters view the world. As the noted political scientist Sidney Verba explained, “Surveys produce just what democracy is supposed to produce – equal representation of all citizens.”

