
Public K-12 schools in the United States educate about 7.3 million students with disabilities – a number that has grown over the last few decades. Disabled students ages 3 to 21 are served under the federal Individuals with Disabilities Education Act (IDEA), which guarantees them the right to free public education and appropriate special education services.
For Disability Pride Month, here are some key facts about public school students with disabilities, based on the latest data from the National Center for Education Statistics (NCES).
July is both Disability Pride Month and the anniversary of the Americans with Disabilities Act. To mark these occasions, Pew Research Center used federal education data from the National Center for Education Statistics to learn more about students who receive special education services in U.S. public schools.
In this analysis, students with disabilities include those ages 3 to 21 who are served under the federal Individuals with Disabilities Education Act (IDEA). Through IDEA, children with disabilities are guaranteed a “free appropriate public education,” including special education and related services.
The 7.3 million disabled students in the U.S. made up 15% of national public school enrollment during the 2021-22 school year. The population of students in prekindergarten through 12th grade who are served under IDEA has grown in both number and share over the last few decades. During the 2010-11 school year, for instance, there were 6.4 million students with disabilities in U.S. public schools, accounting for 13% of enrollment.
The number of students receiving special education services temporarily dropped during the coronavirus pandemic – the first decline in a decade. Between the 2019-20 and 2020-21 school years, the number of students receiving special education services decreased by 1%, from 7.3 million to 7.2 million. This was the first year-over-year drop in special education enrollment since 2011-12.
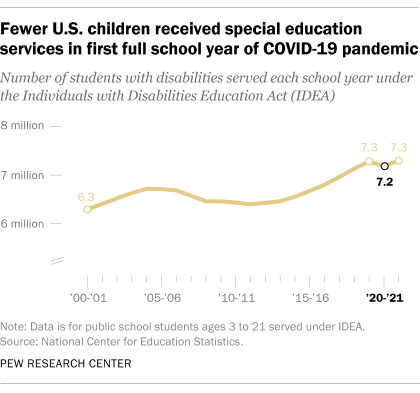
The decline in students receiving special education services was part of a 3% decline in the overall number of students enrolled in public schools between 2019-20 and 2020-21. While special education enrollment bounced back to pre-pandemic levels in the 2021-22 school year, overall public school enrollment remained flat.
These enrollment trends may reflect some of the learning difficulties and health concerns students with disabilities and their families faced during the height of the COVID-19 pandemic, which limited or paused special education services in many school districts.
Many school districts struggle to hire special education professionals. During the 2020-21 school year, 40% of public schools that had a special education teaching vacancy reported that they either found it very difficult to fill the position or were not able to do so.
Foreign languages (43%) and physical sciences (37%) were the only subjects with similarly large shares of hard-to-fill teaching vacancies at public schools that were looking to hire in those fields.
While the COVID-19 pandemic called attention to a nationwide teacher shortage, special education positions have long been among the most difficult for school districts to fill.
The most common type of disability for students in prekindergarten through 12th grade involves “specific learning disabilities,” such as dyslexia. In 2021-22, about a third of students (32%) receiving services under IDEA had a specific learning disability. Some 19% had a speech or language impairment, while 15% had a chronic or acute health problem that adversely affected their educational performance. Chronic or acute health problems include ailments such as heart conditions, asthma, sickle cell anemia, epilepsy, leukemia and diabetes.
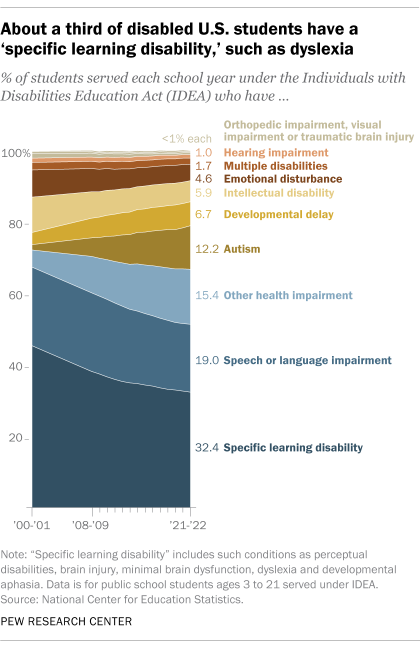
Students with autism made up 12% of the nation’s schoolchildren with disabilities in 2021-22, compared with 1.5% in 2000-01. During those two decades, the share of disabled students with a specific learning disability, such as dyslexia, declined from 45% to 32%.
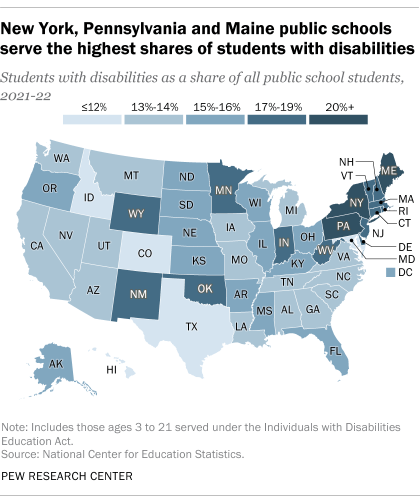
The percentage of students receiving special education services varies widely across states. New York serves the largest share of disabled students in the country at 20.5% of its overall public school enrollment. Pennsylvania (20.2%), Maine (20.1%) and Massachusetts (19.3%) serve the next-largest shares. The states serving the lowest shares of disabled students include Texas and Idaho (both 11.7%) and Hawaii (11.3%).
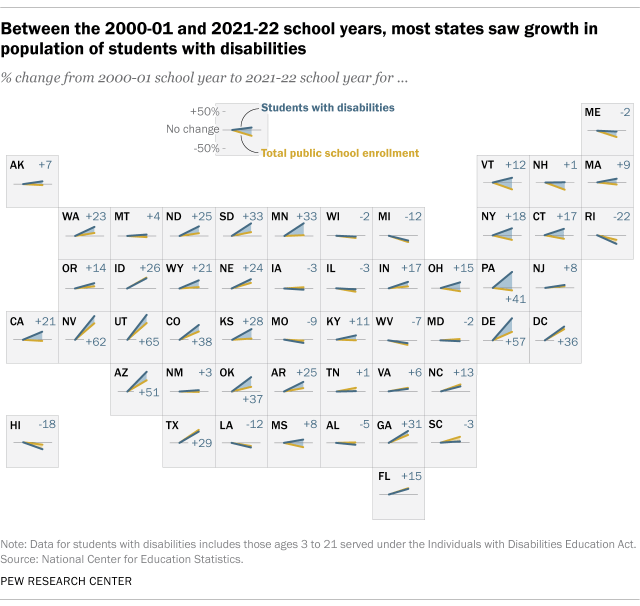
Between the 2000-01 and 2021-22 school years, all but 12 states experienced growth in their disabled student populations. The biggest increase occurred in Utah, where the disabled student population rose by 65%. Rhode Island saw the largest decline of 22%.
These differences by state are likely the result of inconsistencies in how states determine which students are eligible for special education services and challenges in identifying disabled children.
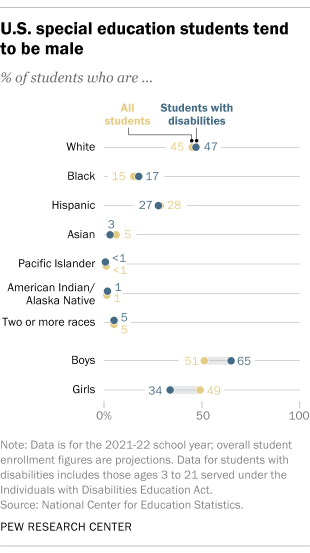
The racial and ethnic makeup of the nation’s special education students is similar to public school students overall, but there are differences by sex. About two-thirds of disabled students (65%) are male, while 34% are female, according to data from the 2021-22 school year. Overall student enrollment is about evenly split between boys and girls.
Research has shown that decisions about whether to recommend a student for special education may be influenced by their school’s socioeconomic makeup, as well as by the school’s test scores and other academic markers.
Note: This is an update of a post originally published April 23, 2020.
