Both men and women turned out at record rates in the 2018 midterm election – mirroring historic turnout increases among other segments of the eligible voting population. Compared with 2014, voter turnout increased by double digits among both men (11 percentage points) and women (12 points).
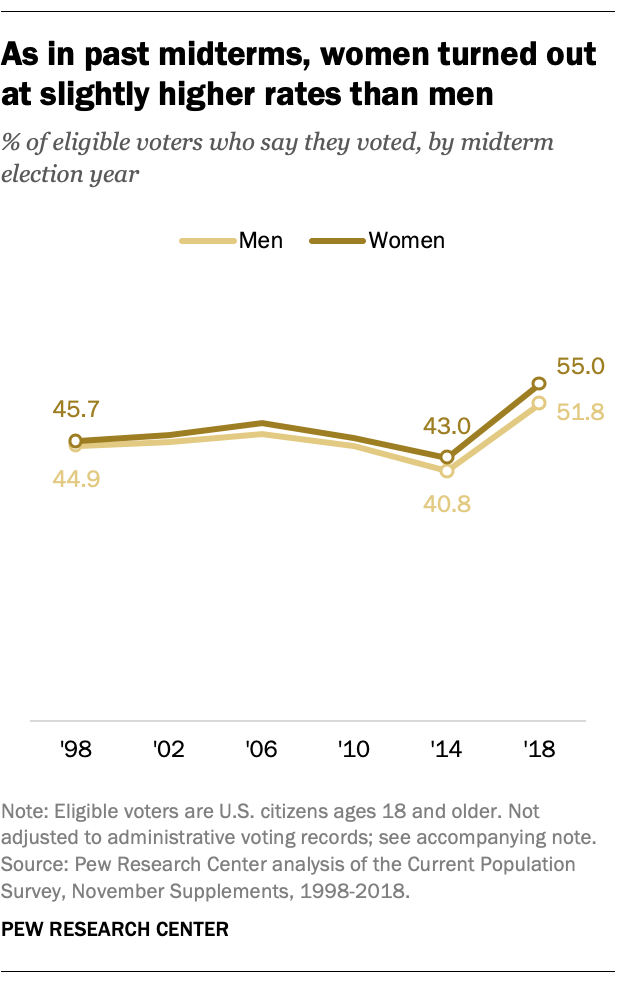
As has been the case in the last five midterm elections dating back to 1998, women turned out to vote at slightly higher rates than men. Over half of women (55%) who were eligible to vote cast ballots in the 2018 midterms in November, as did 51.8% of men, according to a Pew Research Center analysis of newly released data from the U.S. Census Bureau.
The 3.2 percentage point gender gap in turnout is similar to the gap in the 2014 (2.2 points), and slightly bigger than the gap in 2010 (less than 1 point).
In 2018, women made up about the same share of the electorate as they did in the previous five midterms; 53% of voters were women and 47% were men.
Voter turnout was higher among adults of all ages in 2018 relative to 2014 – but increased the most among younger voters. Between 2014 and 2018, turnout among adults under 25 nearly doubled – from 17.1% to 32.4%. Turnout among adults ages 25 to 34 rose by more than 14 percentage points (27.6% to 42.1%) and more than 13 points among those 35 to 44 (37.8% to 51%).
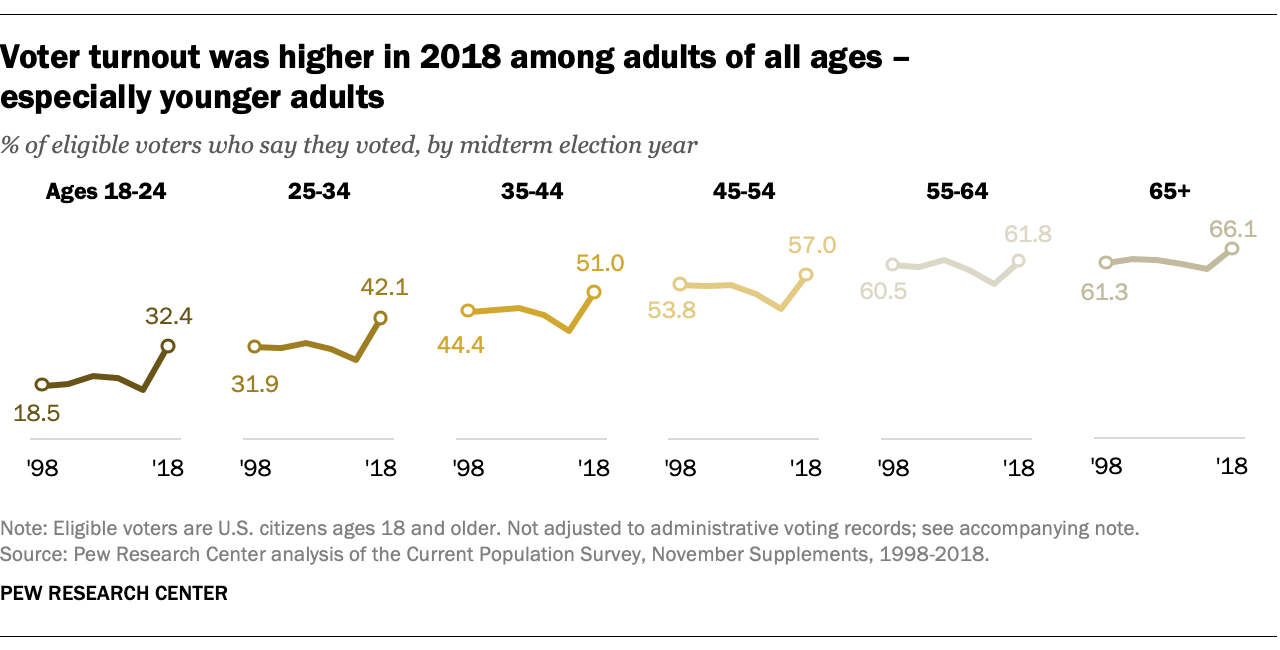
The increases in turnout among older adults were more modest. About two-thirds (66.1%) of eligible adults 65 and older cast a ballot in the 2018 midterm – up from 59.4% in the 2014 midterm election. Those ages 55 to 64 increased their turnout rate by 7.8 percentage points. Older age groups continued to be much more likely than younger groups to vote in the midterms.
The Census Bureau’s biannual Current Population Survey November Voting and Registration Supplement is the best postelection survey of voting behavior available because of its large sample size and its high response rates. It is also one of the few data sources that provides a comprehensive demographic and statistical portrait of U.S. voters.
(Official voting records provide actual individual-level turnout data, but they do not contain voters’ full demographic details. Pew Research Center and other organizations match voter file data to surveys, providing another high-quality source of this information.)
But estimates based on the CPS November Supplement often differ from official voting statistics based on administrative voting records. This difference has been attributed to the way the CPS estimates voter turnout – through self-reports (which may overstate participation) and a method that treats nonresponses from survey respondents as an indication that the survey respondent did not vote (which may or may not be true).
To address overreporting and nonresponse in the CPS, Aram Hur and Christopher Achen in a 2013 paper proposed a weighting method that differs from the one used by the Census Bureau in that it reflects actual state vote counts. As a result, voter turnout rates reported by the Census Bureau (and shown in this analysis) are often higher than estimates based on this alternative weighting approach.
No matter the method used, voter turnout rates in 2018 were the highest for a midterm election measured using the November Voting and Registration Supplement.
The electorate was younger in 2018 than in 2014 as a result of relatively high turnout among young adults. In 2014, 16% of the electorate was under 35. In 2018, these voters made up 21% of the electorate.
Though turnout among women was about 3 percentage points higher than men overall, the difference in turnout by gender varied significantly by age. Among younger voters (18 to 44), the gender gap was wider than the gap for older voters (45 and older).
The gender gap in turnout among the youngest group of voters was also larger than it was in 2014. Five years ago, slightly more women ages 18 to 24 turned out in the midterm election than men (18.2% and 16%, respectively). The 2.2 percentage point gap in 2014 was similar to that of 2010 and 2006. But last year, the gender gap in turnout was significantly larger; 35.3% of women 18 to 24 turned out, compared with 29.5% of men.
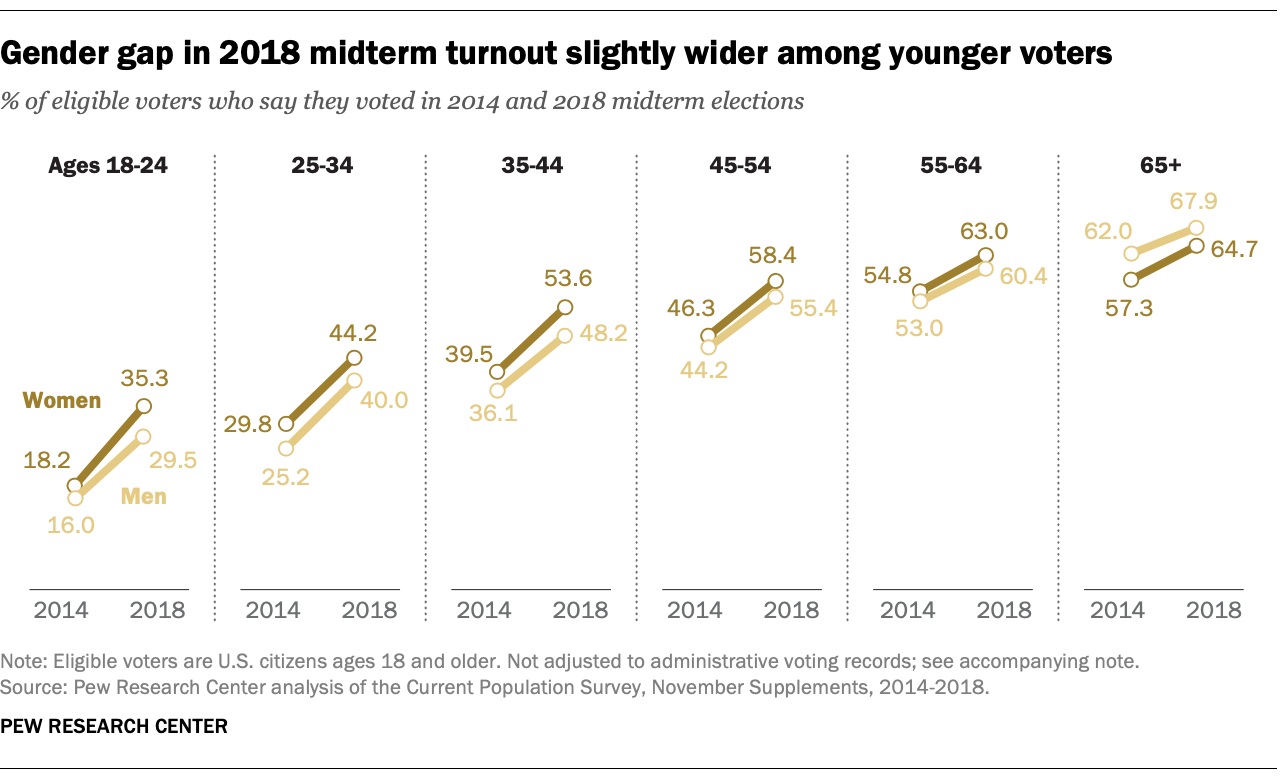
As in 2014, the only age group where turnout was higher for men than women was among adults ages 65 and older (67.9% vs. 64.7%).
Correction: In a previous version of this post, Aram Hur’s name was misspelled in the section “Challenges in estimating voter turnout rates with the Current Population Survey.”
