The U.S. Senate may vote this week on whether to give President Obama so-called “fast-track” authority to finish negotiating the Trans-Pacific Partnership trade agreement. Should the fast-track legislation pass the Senate and then the House, the trade deal would get a straight up-or-down vote in Congress, with no amendments allowed.
The TPP would remove trade barriers among 12 nations on both sides of the Pacific, including the United States, which collectively account for about 40% of the global economy. The TPP countries represent about 40% of all U.S. international trade, and they include three of the top four U.S. trade partners: Canada (No. 1), Mexico (No. 3) and Japan (No. 4).
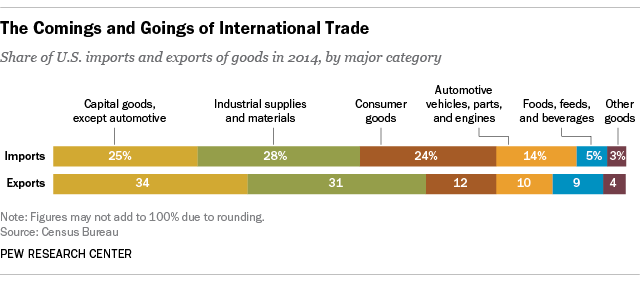
The renewed focus on trade made us wonder: Just what kinds of things does the U.S. export and import, and how have those patterns changed recently? Although services (such as financial services, intellectual property, and travel and transport) are significant, most international trade still involves tangible goods, so that’s what we’ll focus on.
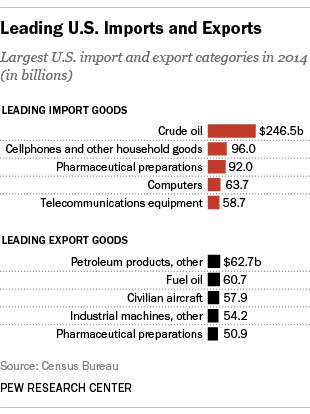
By far the biggest single import is crude oil: The U.S. bought $246.5 billion worth of overseas crude last year. Along with various other petroleum products, natural gas and other energy sources, energy imports in 2014 totaled nearly $355 billion, according to our analysis of detailed trade data from the Census Bureau. (The country spent even more on computer, electronics and telecommunications equipment, which the Census Bureau splits into several different categories: $360 billion or more, depending on what you include.)
No single product category dominates U.S. exports the way energy does with imports. The country exports everything from civilian aircraft ($57.9 billion last year) to “hair and waste materials” ($660 million). But the nation’s energy exports have soared in recent years: They totaled $167.1 billion last year, versus $24.6 billion in 2004, mostly in the form of fuel oil and other petroleum products.
Despite government restrictions on crude-oil exports, $11.6 billion worth was shipped overseas last year, more than twice the level in 2013. The limits were imposed during the energy crises of the 1970s in an effort to conserve domestic resources and hold down imports; with the rise in domestic production, some have argued that those restrictions should be lifted.
Although most of the fastest export growth recently has been in the energy sector, some metals (gold, copper) and agricultural products (eggs and dairy, nuts, soybeans) also have experienced greater-than-average growth.
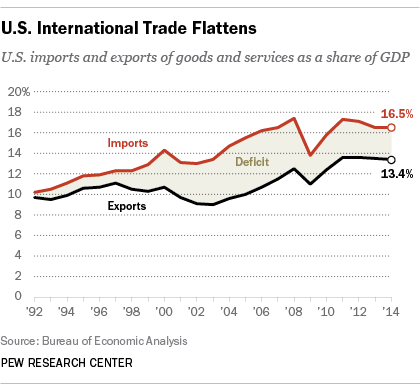
Trade is without question a bigger piece of the U.S. economy than it was in the early 1990s, when the last major trade deal, the North American Free Trade Agreement, was negotiated. Last year, according to data from the Bureau of Economic Analysis, exports totaled $2.34 trillion, equal to 13.4% of gross domestic product (up from 9.7% in 1992). Imports were $2.88 trillion, or 16.5% of GDP (up from 10.2% in 1992); the difference between the two is the trade deficit.
While the U.S. runs a sizable trade surplus in services (more than $230 billion last year), it’s dwarfed by the $771 billion trade deficit in goods: U.S. goods exports amounted to more than $1.6 trillion last year, but the country imported nearly $2.4 trillion worth of goods.
Supporters argue that TPP would give a much-needed boost to U.S. trade, which has been flat or slightly down since 2011, by opening markets in Japan, Southeast Asia and elsewhere to U.S. products. But opponents say the deal could cost U.S. jobs, limit availability of generic drugs, threaten financial reforms and increase inequality.
