

With more attention being paid to economic inequality in the United States, it’s also worth looking at how the nation compares globally. As it happens, the U.S. has one of the most unequal income distributions in the developed world, according to data from the Organization for Economic Cooperation and Development — even after taxes and social-welfare policies are taken into account.
Income, of course, isn’t the only way to measure economic inequality, but it is the most common, especially when making cross-national comparisons. Income inequality often is expressed in terms of the Gini index, a summary statistic that measures the dispersion of incomes on a scale of zero (everyone has exactly the same income) to 1 (one person has all the income).
The OECD, a group of 34 mostly developed economies, calculates Gini coefficients for most of its member countries, both before and after taxes and transfer payments. That helps address criticism from some economists that income-based measures of inequality ignore the redistributive impact of such programs as Social Security, the earned income tax credit and unemployment insurance. (We looked at the 31 OECD countries that had both sets of Gini scores for a reasonably recent year, in most cases 2010.)
Before accounting for taxes and transfers, the U.S. ranked 10th in income inequality; among the countries with more unequal income distributions were France, the U.K. and Ireland. But after taking taxes and transfers into account, the U.S. had the second-highest level of inequality, behind only Chile. (Mexico and Brazil had higher after-tax/transfer Gini scores, but no “before” scores with which to compare them; including them would push the U.S. down to fourth place.)
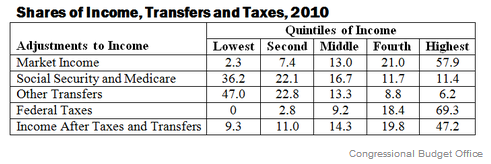
It’s not that taxes and social-insurance policies in the U.S. have no redistributive effect. Before taxes and transfers, according to a new Congressional Budget Office report, the bottom 20% of Americans had 2.3% of all income, while the top 20% had 57.9%. After taxes and transfers, the bottom 20%’s share rose to 9.3%, while the top 20%’s share fell to 47.2%. (Thanks to The New York Times’ Economix blog for the chart below).
However, the OECD data show that U.S. tax and spending policy does relatively little, compared with its peers in the developed world, to reduce inequality (a point made elsewhere using a similar dataset). Among the 31 OECD countries for which recent “before” and “after” Gini scores are available, the average differential was 0.163; for the U.S. the differential was 0.119. The country where tax and transfer policies do the most to reduce income inequality? Ireland, which ranked highest before taxes and transfers but 10th after.
