
When it comes to how much social acceptance there is for people who are gay, lesbian, bisexual, nonbinary or transgender in the U.S. today, LGBTQ adults see the most acceptance for those who are gay or lesbian.
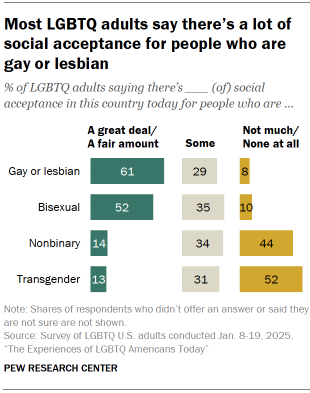
A majority (61%) say there is a great deal or a fair amount of acceptance for people who are gay or lesbian. And about half (52%) say the same for those who are bisexual.
Much smaller shares say there’s a great deal or a fair amount of acceptance for people who are nonbinary (14%) or transgender (13%).
Roughly half (52%) say there’s not much or no acceptance at all for transgender people. And 44% say this is the case for nonbinary people.
Views on social acceptance are mostly similar across LGBTQ groups. But those who are bisexual (56%) are more likely than those who are gay or lesbian (50%) or transgender (46%) to say there’s a lot of acceptance for bisexual people.
LGBTQ adults who are nonbinary (57%) are more likely than LGBTQ men and women (43% each) to say there is not much or no acceptance at all for nonbinary people.
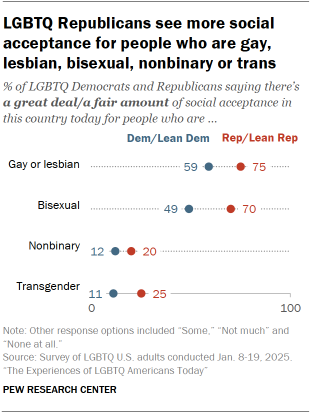
LGBTQ Republicans are more likely than LGBTQ Democrats to say there’s a great deal or a fair amount of acceptance for people who are:
- Gay or lesbian (75% vs. 59%)
- Bisexual (70% vs. 49%)
- Nonbinary (20% vs. 12%)
- Transgender (25% vs. 11%)
Views of social acceptance 10 years ago and 10 years from now
We also asked LGBTQ adults their views of social acceptance today for people who are gay, lesbian, bisexual, nonbinary or transgender compared with 10 years ago, and how they expect things to be 10 years from now. What we found is that majorities see progress over the past decade and expect more acceptance in the future.
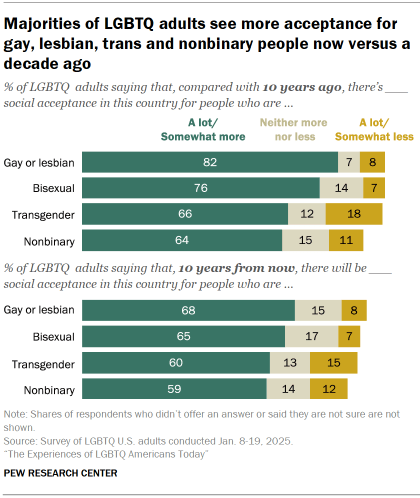
Most LGBTQ adults say acceptance has increased for people who are:
- Gay or lesbian (82% say there’s a lot or somewhat more acceptance today than 10 years ago)
- Bisexual (76%)
- Transgender (66%)
- Nonbinary (64%)
Even among those who say there isn’t much acceptance for these groups, majorities see more acceptance than in the past.
Looking ahead, majorities also expect there to be even more social acceptance for these groups in the future. These shares range somewhat: 68% think there will be more acceptance for people who are gay or lesbian 10 years from now, while 59% say the same for nonbinary people.
Views by age
Similar shares of LGBTQ adults ages 18 to 49 and ages 50 and older say there’s at least somewhat more acceptance for people who are gay or lesbian compared with 10 years ago (83% and 82%). But younger LGBTQ adults are more likely than older ones to say there’s more acceptance today for people who are:
- Bisexual (78% vs. 69%)
- Transgender (68% vs. 57%)
- Nonbinary (68% vs. 52%)
Impact of Obergefell v. Hodges on acceptance of same-sex couples
In 2015, the Supreme Court ruled in Obergefell v. Hodges that the right to same-sex marriage is guaranteed across the U.S. We asked LGBTQ adults how they think this decision has impacted society’s acceptance of same-sex couples.
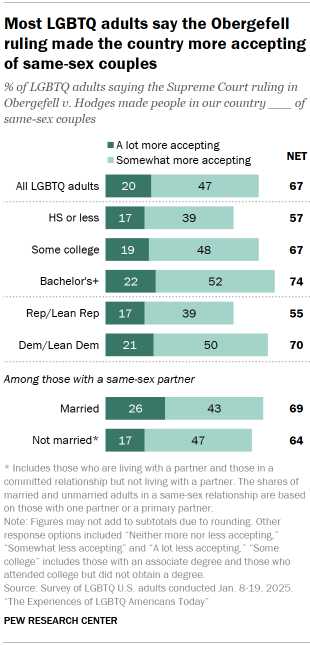
Two-thirds of LGBTQ adults say the ruling made the country at least somewhat more accepting of same-sex couples. This includes 20% who say it has made people a lot more accepting.
About a quarter (24%) say Obergefell made people neither more nor less accepting. And 9% say it made them a lot or somewhat less accepting of same-sex couples.
Views by education
LGBTQ adults with more education are more likely than those with less to say the ruling has made the country more accepting of same-sex couples.
About three quarters (74%) of LGBTQ adults with at least a bachelor’s degree say this. By comparison, two-thirds of those with some college and 57% of those with a high school diploma or less education say the same.
Views by party
Among LGBTQ adults, Democrats are more likely than Republicans to say Obergefell has made the country more accepting of same-sex couples (70% vs. 55%).
The difference is mostly driven by the shares saying the ruling has made the country somewhat more accepting of same-sex couples. Half of LGBTQ Democrats say this, compared with 39% among LGBTQ Republicans. There’s a much smaller difference between the shares saying Obergefell made people a lot more accepting (21% vs. 17%).
Views by marital status
Among LGBTQ adults who are in a committed same-sex relationship, similar shares of those who are married and those who are not say the ruling has made the country more accepting of same-sex couples (69% vs. 64%).2
However, those in a same-sex marriage are more likely than those who are in a same-sex relationship but not married to say Obergefell has made the country a lot more accepting of same-sex couples (26% vs. 17%).
Factors that might increase social acceptance for LGBTQ people
Majorities of LGBTQ adults say each of the following would do a great deal or a fair amount to increase acceptance of LGBTQ people:
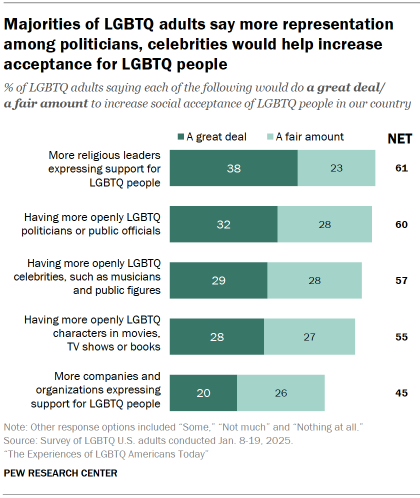
- More religious leaders expressing support for LGBTQ people (61%)
- Having more openly LGBTQ politicians or public officials (60%)
- Having more openly LGBTQ celebrities, such as musicians and public figures (57%)
- Having more openly LGBTQ characters in movies, TV shows or books (55%)
Fewer than half (45%) say having more companies and organizations expressing support for LGBTQ people would do a lot to increase social acceptance.
Views by education
LGBTQ adults with at least a bachelor’s degree are more likely than those with less education to say each of these things we asked about would do a lot to increase acceptance. For example, 73% of those with at least a bachelor’s degree say more religious leaders expressing support for LGBTQ people would do a lot. By comparison, 55% of those with some college or less education say the same.
Views by party
By double-digit margins, LGBTQ Democrats are more likely than LGBTQ Republicans to say the following would do a great deal or a fair amount to increase acceptance:
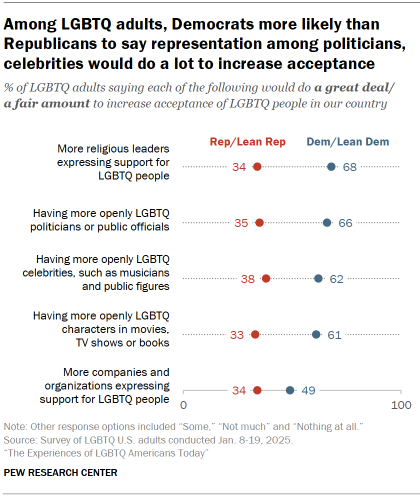
- More religious leaders expressing support for LGBTQ people (68% vs. 34%)
- More openly LGBTQ politicians or public officials (66% vs. 35%)
- More openly LGBTQ celebrities, such as musicians and public figures (62% vs. 38%)
- More openly LGBTQ characters in movies, TV shows or books (61% vs. 33%)
- More companies and organizations expressing support for LGBTQ people (49% vs. 34%)


