This Pew Research Center study uses a multimethod approach to understanding what “news” means to Americans today. The project includes three different types of research methodologies: a qualitative online discussion board with 57 U.S. adults, a nationally representative survey of 9,482 U.S. adults conducted through Pew Research Center’s American Trends Panel (ATP), and on-the-record, in-depth interviews with 13 journalists and editors.
This is the latest analysis from the Pew-Knight Initiative, a research program funded jointly by The Pew Charitable Trusts and the John S. and James L. Knight Foundation. Find related reports online at https://www.pewresearch.org/pew-knight/.
Online discussion board
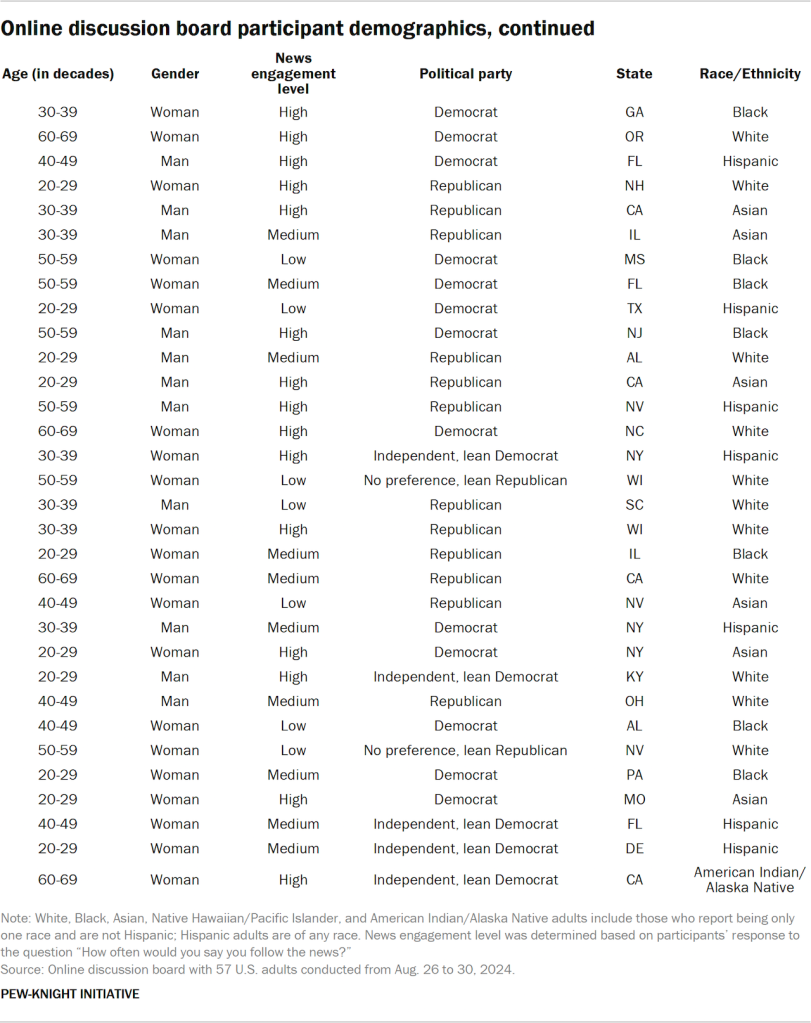
An online discussion board – also referred to as an online bulletin board – is a digital, multimedia qualitative research method that allows participants to share opinions, engage in activities and respond to posted topics asynchronously in a private environment. The online discussion board was conducted by the research firm PSB Insights with 57 U.S. adults from Aug. 26 to 30, 2024. These discussions are not nationally representative, and the results are not framed in quantitative terms. This method allowed participants to complete a range of activities, including open-ended questions, illustrations, rating exercises, and video and screen recordings, to get at their understandings of and experiences with news. To learn more, refer to our accompanying Decoded blog post.
The research team fielded the online discussion board over the course of one week. Participants were expected to spend 20 to 30 minutes per day for each of the three days activities were posted, for a total of 60 to 90 minutes. Participants logged onto a virtual platform called Qualzy at their own pace each day for three days, and moderators probed responses within the platform when applicable to understand participants’ underlying emotions and motivations. Fifty-seven participants ultimately completed all activities, yielding a 95% response rate from the 60 participants initially recruited.
Recruitment
PSB Insights and QualRecruit recruited participants using quotas for age, party affiliation, education, race and ethnicity, community type (urban, suburban or rural) and self-reported news engagement level. All participants had to be 18 years of age or older (19 or older if living in Alabama or Nebraska and 21 or older if living in Mississippi), live in the U.S., and have daily access to a computer or mobile device with high-speed internet access and a working webcam.
Lastly, eligible participants had to be willing and able to contribute to the research, answer questions in the online discussion board during the week of fieldwork and sign an informed consent form before they could participate. This included agreement that all online discussion board responses could be used in research reports, though participants’ names and identifying information would remain private – including to other participants – and not be used in any reports.
Participants who completed all activities by 11:59 p.m. ET on Friday, Aug. 30, 2024, were paid an incentive of $150 for their participation. To encourage participants to complete all questions and activities in the online discussion board early enough to allow the research team to probe and ask follow-up questions in the latter end of the week, those who completed all activities by 11:59 p.m. ET on Wednesday, Aug. 28, were entered into a raffle to win one of 10 $50 gift certificates in addition to their $150 incentive for participating. Forty-nine participants did so, and all 10 raffle prizes were randomly issued to 10 eligible participants.

Discussion
The Pew Research Center and PSB Insights research teams developed the discussion guide through an iterative process. No edits were made during fielding. Once participants completed the informed consent form, confidentiality agreement and introduction to their moderators on the online platform, they followed this discussion guide:
- “What Is Important to Me?”: The participants worked through questions and activities regarding what topics they have been interested in lately. The discussion covered the participants introducing themselves to the moderators, discussing general topics that interest them and how long they have been interested in these topics.
- “How I Define ‘News’”: This section examined what the term “news” means to participants, examples of what participants believe “news” is, and examples of what participants believe “news” is not.
- “My Relationship With the News”: Participants worked through questions and activities around how they perceive “news,” how actively they seek it out and how they react to certain types of news stories.
- “My Preferred Way to Get News”: This section focused on the ways in which “news” is presented that catches the attention of participants, rating different scenarios on a scale of “definitely news” to “not news at all.” Participants showed examples of what they consider to be “news” from their social media feeds or other sources.
- “News You Trust”: The participants worked through questions and activities around their trust in “news,” including their trusted sources and what types of bias there may or may not be within “news.”
- “News Scale”: Participants scored various potential definitions of “news” based on what they believed best defines it.
The informed consent form, confidentiality agreement, moderator introductions and “What Is Important to Me” and “How I Define ‘News’” sections were posted on the online platform at 8 a.m. ET on Aug. 26, 2024. “My Relationship With the News” and “My Preferred Way to Get News” were posted at 8 a.m. ET on Aug. 27, while “News You Trust” and “News Scale” were posted at 8 a.m. ET on Aug. 28.
Analysis
All human-generated and checked transcripts and files were analyzed and coded by the research team in ATLAS.ti, a qualitative data analysis and research software program. All told, we coded 78 documents and 1,311 activities (23 activities per participant).
The questions and activities were organized into four thematic sections: “How I Define News,” “News You Trust,” “My Relationship With the News” and “My Preferred Way to Get News.” (For the purposes of coding, the “What Is Important to Me,” “News Scale” and “How I Define ‘News’” sections were folded into “How I Define News.”) Two coders individually analyzed each section in ATLAS.ti, using a codebook generated and revised both deductively (before analysis, based on the Center’s and external existing research) and inductively (during early analysis, based on the perspectives of participants themselves). Coders also compiled analytical memos for every section, noting similarities and differences across participants and connecting individual experiences and perspectives to broader themes. Once coding was complete, coders discussed and combined their memos to build out key findings.
Together, these exercises allowed us to identify key patterns across the data and then use ATLAS.ti to organize and classify all relevant quotes, as well as to match those quotes to the demographic characteristics of those who said them. We took care to ensure that multiple coders analyzed every response and activity throughout this process and that the viewpoints expressed in this data essay accurately captured the range of opinions and experiences of our participants.
Reporting
The accompanying data essay included select quotations of responses from discussion board participants. Quoted matter was lightly edited by Pew Research Center staff for spelling, punctuation and clarity prior to publication.
The American Trends Panel survey methodology
Overview
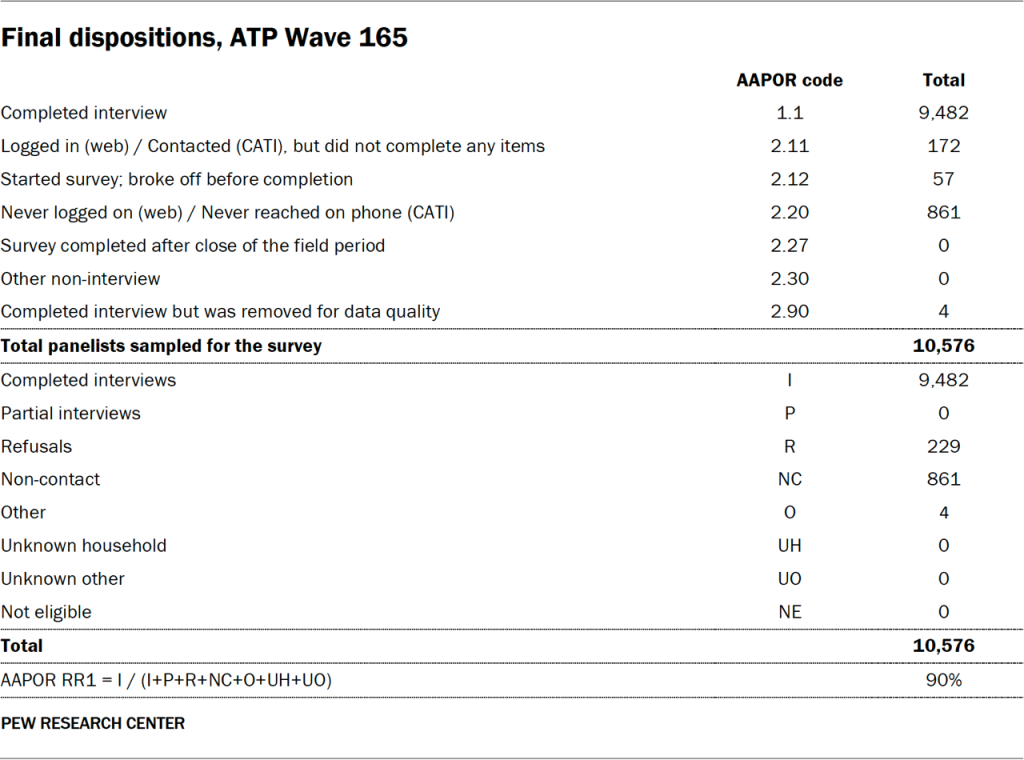
Survey data in this report comes from Wave 165 of the American Trends Panel (ATP), Pew Research Center’s nationally representative panel of randomly selected U.S. adults. The survey was conducted from March 10 to 16, 2025. A total of 9,482 panelists responded out of 10,576 who were sampled, for a survey-level response rate of 90%.
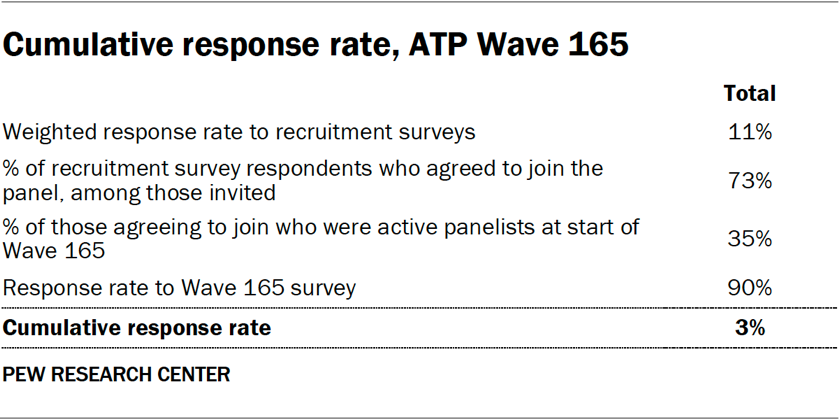
The cumulative response rate accounting for nonresponse to the recruitment surveys and attrition is 3%. The break-off rate among panelists who logged on to the survey and completed at least one item is 1%. The margin of sampling error for the full sample of 9,482 respondents is plus or minus 1.4 percentage points.
SSRS conducted the survey for Pew Research Center via online (n=9,231) and live telephone (n=251) interviewing. Interviews were conducted in both English and Spanish.
To learn more about the ATP, read “About the American Trends Panel.”
Panel recruitment
Since 2018, the ATP has used address-based sampling (ABS) for recruitment. A study cover letter and a pre-incentive are mailed to a stratified, random sample of households selected from the U.S. Postal Service’s Computerized Delivery Sequence File. This Postal Service file has been estimated to cover 90% to 98% of the population.1 Within each sampled household, the adult with the next birthday is selected to participate. Other details of the ABS recruitment protocol have changed over time but are available upon request.2 Prior to 2018, the ATP was recruited using landline and cellphone random-digit-dial surveys administered in English and Spanish.
A national sample of U.S. adults has been recruited to the ATP approximately once per year since 2014. In some years, the recruitment has included additional efforts (known as an “oversample”) to improve the accuracy of data for underrepresented groups. For example, Hispanic adults, Black adults and Asian adults were oversampled in 2019, 2022 and 2023, respectively.
Sample design
The overall target population for this survey was noninstitutionalized persons ages 18 and older living in the United States. All active panel members were invited to participate in this wave.
Questionnaire development and testing
The questionnaire was developed by Pew Research Center in consultation with SSRS. The web program used for online respondents was rigorously tested on both PC and mobile devices by the SSRS project team and Pew Research Center researchers. The SSRS project team also populated test data that was analyzed in SPSS to ensure the logic and randomizations were working as intended before launching the survey.
Incentives
All respondents were offered a post-paid incentive for their participation. Respondents could choose to receive the post-paid incentive in the form of a check or gift code to Amazon.com, Target.com or Walmart.com. Incentive amounts ranged from $5 to $20 depending on whether the respondent belongs to a part of the population that is harder or easier to reach. Differential incentive amounts were designed to increase panel survey participation among groups that traditionally have low survey response propensities.
Data collection protocol
The data collection field period for this survey was March 10 to March 16, 2025. Surveys were conducted via self-administered web survey or by live telephone interviewing.
For panelists who take surveys online:3 Postcard notifications were mailed to a subset on March 10.4 Survey invitations were sent out in two separate launches: soft launch and full launch. Sixty panelists were included in the soft launch, which began with an initial invitation sent on March 10. All remaining English- and Spanish-speaking sampled online panelists were included in the full launch and were sent an invitation on March 11.
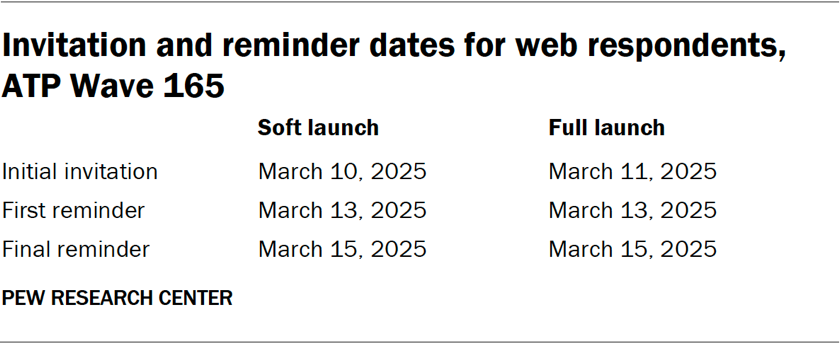
Panelists participating online were sent an email invitation and up to two email reminders if they did not respond to the survey. ATP panelists who consented to SMS messages were sent an SMS invitation with a link to the survey and up to two SMS reminders.
For panelists who take surveys over the phone with a live interviewer: Prenotification postcards were mailed on March 7. Soft launch took place on March 11 and involved dialing until a total of four interviews had been completed. All remaining English- and Spanish-speaking sampled phone panelists’ numbers were dialed throughout the remaining field period. Panelists who take surveys via phone can receive up to six calls from trained SSRS interviewers.
Data quality checks
To ensure high-quality data, Center researchers performed data quality checks to identify any respondents showing patterns of satisficing. This includes checking for whether respondents left questions blank at very high rates or always selected the first or last answer presented. As a result of this checking, four ATP respondents were removed from the survey dataset prior to weighting and analysis.
Weighting
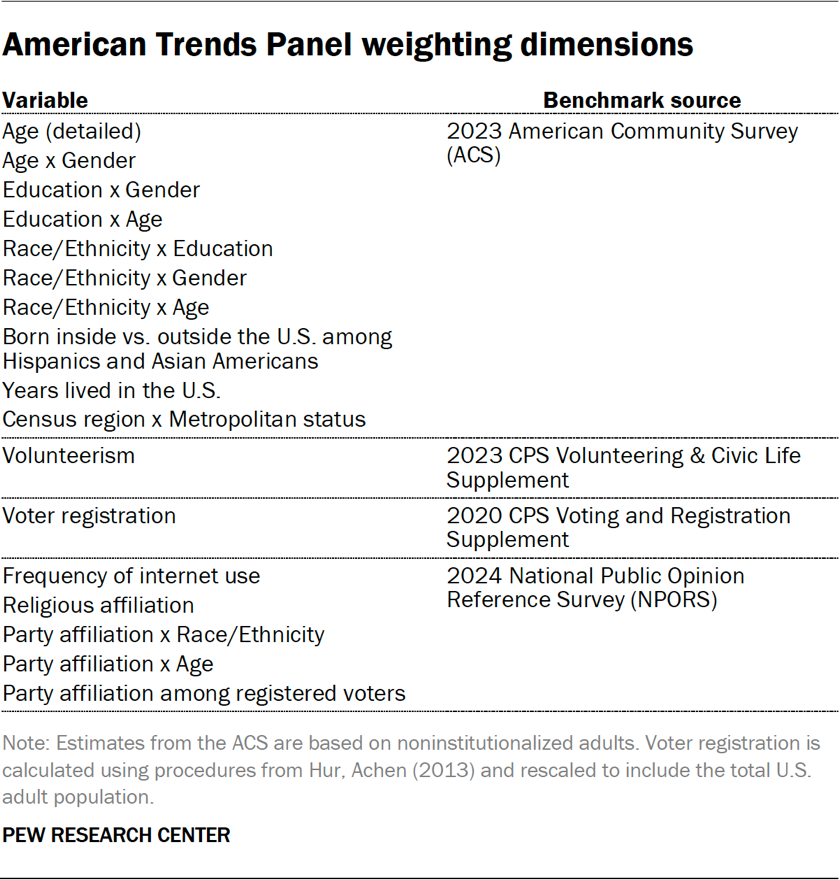
The ATP data is weighted in a process that accounts for multiple stages of sampling and nonresponse that occur at different points in the panel survey process. First, each panelist begins with a base weight that reflects their probability of recruitment into the panel. These weights are then calibrated to align with the population benchmarks in the accompanying table to correct for nonresponse to recruitment surveys and panel attrition. If only a subsample of panelists was invited to participate in the wave, this weight is adjusted to account for any differential probabilities of selection.
Among the panelists who completed the survey, this weight is then calibrated again to align with the population benchmarks identified in the accompanying table and trimmed at the 1st and 99th percentiles to reduce the loss in precision stemming from variance in the weights. Sampling errors and tests of statistical significance take into account the effect of weighting.
The following table shows the unweighted sample sizes and the error attributable to sampling that would be expected at the 95% level of confidence for different groups in the survey.
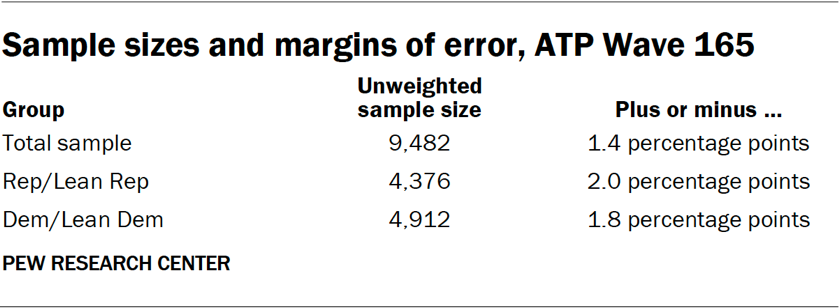
Sample sizes and sampling errors for other subgroups are available upon request. In addition to sampling error, one should bear in mind that question wording and practical difficulties in conducting surveys can introduce error or bias into the findings of opinion polls.
Dispositions and response rates
Journalist and editor interviews
Pew Research Center conducted a series of individual on-the-record, in-depth interviews from July 18 to Sept. 6, 2024, with 13 journalists and editors at varying levels of editorial leadership. The interviews explored journalists’ perspectives on their audiences’ understanding of news, as well as how these shifts are impacting news organizations.
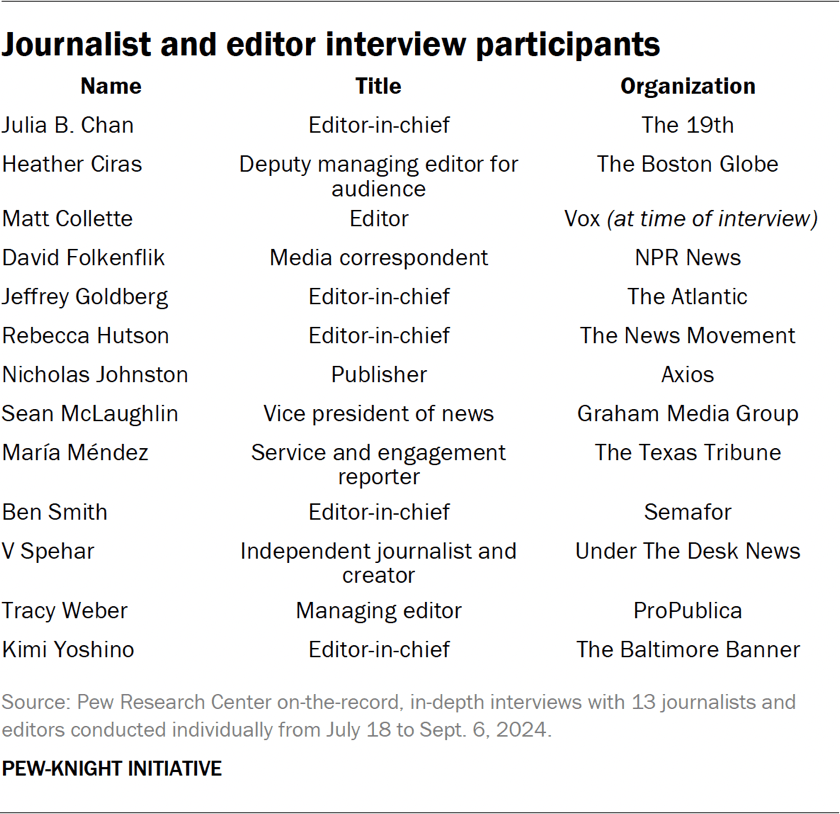
Participants were recruited to represent a variety of news platforms, journalistic approaches, geographic focuses, audiences, business models and demographics. Each interview was held via phone for around 20 to 40 minutes.
We used semistructured interviews, a method that combines the consistency of asking a predetermined set of open questions with the flexibility of allowing the interviewer to follow the movement of the conversation and dive into topics in more detail. All interviews, conducted by former Pew Research Center Senior Writer Mark Jurkowitz, followed this discussion guide as a starting point:
- As you look at the technological changes and consumption habits in the information industry, do you believe that the definition of news is changing/evolving?
- If you answered yes, how would you best describe that change?
- How much of this change is driven by the public’s views or behaviors related to news?
- What other factors are contributing to that change?
- How does this change affect how you do your job? How your organization reports and disseminates information?
- Regardless of how you answered, what are the enduring qualities and practices that define news?
- Regardless of how you answered, do you feel that “professionally produced” news reporting is less influential in the current information landscape?
- What role do you think journalists’ own identities play in their work/how they do their job? To what extent do you see this mattering, or not, among your audiences?
The accompanying data essay included select quotations of responses from interview participants. Quoted matter was lightly edited by Pew Research Center staff for spelling, punctuation and clarity prior to publication.
