
Pew Knight Initiative
The Pew-Knight Initiative supports new research on how Americans absorb civic information, form beliefs and identities, and engage in their communities.
Pew Research Center is a nonpartisan, nonadvocacy fact tank that informs the public about the issues, attitudes and trends shaping the world. Knight Foundation is a social investor committed to supporting informed and engaged communities. Learn more >
A recent Pew Research Center study from the Pew-Knight Initiative examined how Americans decide what “news” means to them. The study included a nationally representative survey of U.S. adults, as well as in-depth interviews with journalists. But the centerpiece of the study was a qualitative research method called online discussion boards, which helped us understand the public’s attitudes and experiences around news.
This first foray by Pew Research Center into online discussion boards, conducted by PSB Insights, was as much an exploration of a new approach to qualitative research as it was a study of how people define and think about news.
We have long used other qualitative research methods in our work, including focus groups to study the views of specific groups of people and cognitive interviews to help design and improve our survey questions. These methods often add depth and breadth to our survey findings and allow us to understand Americans’ attitudes and experiences in their own words.
Here, we share the “why” and “how” behind our use of an online discussion board as a qualitative method. We’ll also discuss three approaches we used as part of our recent study to better understand how people classify, evaluate and feel about news, along with key lessons we learned from this process.
What are online discussion boards, and why did we use them?
An online discussion board – also referred to as an online bulletin board – is a digital, multimedia qualitative research method that allows participants to share opinions, engage in activities and respond to posted topics asynchronously in a private environment. Researchers or moderators can reach out to the same participants with new or follow-up questions over time, rather than conduct only one interview or focus group.
One key strength of online discussion boards is their flexibility:
- Privacy: A moderator oversees online discussion boards and engages with each participant, asking follow-up questions that are tailored to the participant in a private environment. This allows them to respond in a comfortable setting without being influenced by other participants, especially when it comes to topics such as their trust in news.
- Pace: Unlike with focus groups or interviews, online discussion board participants complete activities at their own pace each day, logging on whenever it suits their schedules and preferences.
- Scope: Online discussion boards can range from a few days to several months and can work with small or large participant groups alike. This offers researchers a level of access to participants’ concrete, everyday experiences on a scale that might not be possible with other methods.
- Platform: The fully virtual method is optimized for desktop, tablet and mobile to suit a range of participant needs. But as we discuss in our key takeaways, it’s important to consider how each activity works across devices.
- Data: This method also allows participants to complete a wide range of virtual activities, including open-ended responses, illustrations, ranking exercises, photo submissions, and video and screen recordings.
Online discussion boards have a few important disadvantages and considerations to keep in mind. By their nature, these boards exclude participants who are not tech-savvy or digitally trusting. Even the easiest-to-use online discussion boards can experience technical issues. And while human moderation provides the ability to follow up on participants’ responses (as moderators do in focus groups or interviews), monitoring dozens of people who are completing several activities each day can lead to missed opportunities for additional questions. Asking for clarification too many times via online comments can also frustrate participants.
How did we use them, and what questions did they answer?
The online discussion board we used for this study was moderated by the research firm PSB Insights and took place from Aug. 26 to 30, 2024, among 57 U.S. adults. Participants reflected a range of ages, party affiliations, education levels, racial and ethnic backgrounds, community types (urban, suburban or rural) and self-reported news engagement levels.
As is the case with other qualitative methods, our sample was not nationally representative, and we did not report the findings as such. Instead, we used the online discussion board as a window into individual experiences and perspectives. Our findings also informed the development of questions we later asked in a nationally representative survey of U.S. adults.
The research team fielded the online discussion board over the course of five days, with new activities posted each morning from Monday to Wednesday. Participants logged onto a virtual platform called Qualzy and spent 20 to 30 minutes per day for each of the three days activities were posted. Moderators followed up on the participants’ responses within the platform when applicable to better understand their views and motivations.
The online discussion board allowed us to understand how each participant defines “news” in their own words; their relationship with and trust in news; and how they consume it. Here are three approaches we used to find out more about these topics:
We used rating scenarios to learn how people classify news. Prior research has found that people often categorize information as “news” along a continuum – rather than as a binary yes or no – and that perceptions vary depending on the platform, source and individual. This activity allowed us to probe how participants assessed information topics and sources on a spectrum from “Not news at all” to “Definitely news,” often holding other qualities of the information constant.
When considering information sources, for instance, we asked participants to rate five (randomized) scenarios focused on a story about a U.S. stock market crash to ensure that the main difference in participants’ minds was the source of information itself:
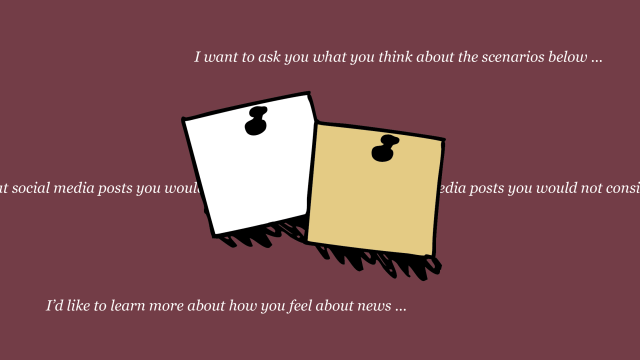
Now, I want to ask you what you think about the scenarios below.
Imagine the same piece of information presented in five different ways…
- Scenario 1: An article about a stock market crash on X (formerly Twitter) posted by a news outlet
- Scenario 2: A short video on YouTube with a person commenting on a stock market crash
- Scenario 3: Your friends discussing a stock market crash in a group text message
- Scenario 4: An article about a stock market crash on the front page of a newspaper
- Scenario 5: A TV program host talking about a stock market crash
Please click on and drag each scenario onto the scale that goes from “Not news at all” to “Definitely news.”
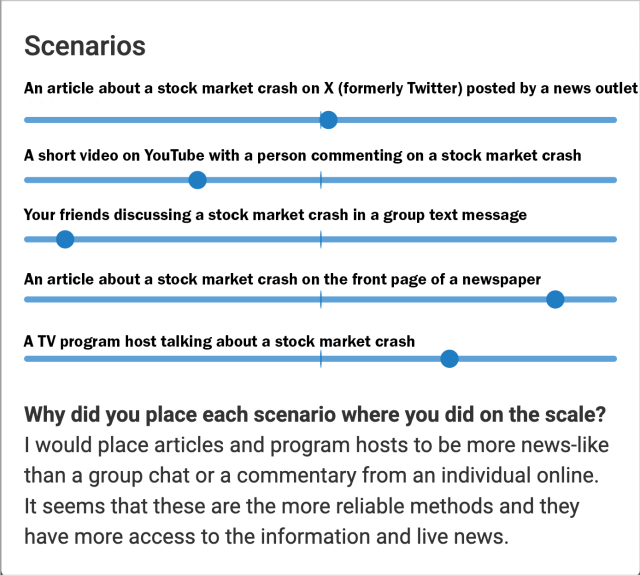
Once our participants completed this activity, we followed up to ask why participants rated each scenario the way they did.
We used a similar approach to ask about information topics, where we found that classic “hard news” topics like elections and global conflicts persist in people’s minds as news. By contrast, many participants see information about celebrities’ lives not as news, but as entertainment. We ultimately used these findings to inform a question we asked in our nationally representative survey of U.S. adults.
We used screen recordings to learn how people evaluate news online. The aim of this activity was to understand how each participant’s idea of what news is aligned with their online behaviors.
We drew from prior research that asked in-depth interview participants to walk through their typical use of particular social media platforms. We employed a screen recording module that allowed participants to navigate the feed of the social media platform they use the most while recording their screens and their thoughts about what they saw as they did so.
In the online discussion board, we first asked participants if they get any of their news from social media. If the participants answered yes, they received these instructions:
We’re going to end today with a creative exercise. We would like to understand more about what news means to you. The way that you are going to share the feedback is by recording your screen and verbally telling us your thoughts.
The online discussion board then included instructions on how to create and upload screen recordings on different devices and asked:

Once you start recording, please go ahead and open up the social media app that you use the most. Please scroll through your social media feed as you record and tell me what social media posts you would consider to be news, what social media posts you would not consider to be news, and why.
We were initially worried that this activity might be too technologically difficult for our participants. But among the 52 participants who said they use social media for news, 34 successfully submitted screen recordings for analysis. Those who said they do not use social media for news were asked to submit screenshotted examples of what they think are news and not news.
This activity illuminated – in a way most other qualitative or quantitative methods cannot – how participants’ perceptions of what news is and what news they consume align (or do not align) with their day-to-day behaviors.
We used canvas illustrations to learn how people emotionally react to news. This isn’t the first time we’ve asked people how they view news. But instead of asking this as a regular survey question or even an open-ended question, we enabled participants to show their feelings in a visual format, creating expressive image collages that reflect their emotional responses to news.
In the online discussion board, we asked participants:
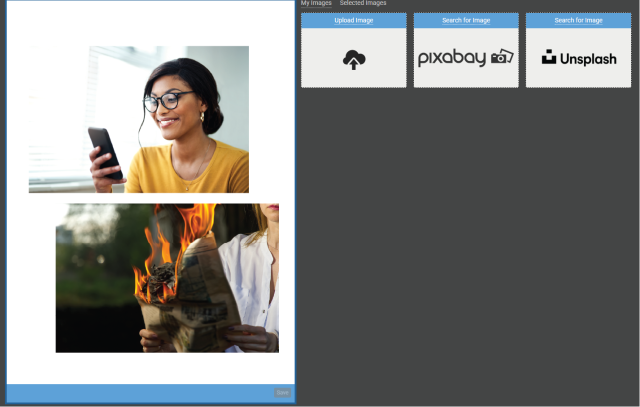
I’d like to learn more about how you feel about news using this canvas. The canvas is a blank space that you can use for uploading images or adding text, color, and shapes. You can use this canvas to add text by pressing the “Enter Text” button. You can also search for an image to add by pressing the “Pick Images” button and then using either Pixabay or Unsplash and even upload images from your own device if you’d like to.
We then followed up by asking participants to share more about the image or collage they created and why they selected the images they did.
This exercise painted a clear picture of people’s mixed emotional responses to news, with participants often placing positive and negative images side-by-side to depict the contrasting feelings it evoked for them.
How did we analyze the data?
After conducting our online discussion board, we analyzed and coded transcripts, image files and video files using ATLAS.ti. This is a qualitative data analysis and research software program that helps researchers sort through, categorize and identify patterns in this type of data in a systematic way. All told, we coded 78 documents and 1,311 questions and activities, or 23 questions and activities per participant.
We organized our questions and activities into four thematic sections: “How I Define News,” “News You Trust,” “My Relationship With the News” and “My Preferred Way to Get News.” (For the purposes of coding, the “What Is Important to Me,” “News Scale” and “How I Define ‘News’” sections were folded into “How I Define News.”) Two coders individually analyzed every section in ATLAS.ti, using a codebook generated and revised both deductively (before analysis, based on existing internal and external research) and inductively (during early analysis, based on the perspectives of participants themselves).
Coders also compiled analytical memos – where researchers record insights, questions and themes that arose during analysis to refine their understanding of the data – for every section of the online discussion board. They noted similarities and differences across participants and connected individual experiences and perspectives to broader themes. Once coding was complete, the coders discussed and combined their memos to build out key findings.
Together, these exercises allowed us to identify key patterns across the data and then use ATLAS.ti to organize and classify all relevant quotes, as well as to match those quotes to the demographic characteristics of those who said them.
What did we learn from the process?
- Online discussion boards allow for in-depth exploration of complex concepts. As with any research method, the approach should always be tailored to meet the goals of a study. This method excelled at examining the gray areas in participants’ thinking and the discrepancies between their attitudes and behaviors. The ability to develop a range of multimedia activities, rather than simply asking open-ended questions, also allowed us to measure the same concepts in different ways.
- They are less suited for studying groups who are not tech-savvy or digitally trusting. Online discussion boards can be invaluable for those comfortable with technology, but they may exclude important voices.
- Crafting the right activities and questions is complex and requires thoughtful design. For example, it was not easy to develop source or topic scenarios that were engaging and relatable, but not too politicized, for participants to rate, rank or sort through as “news” or not.
- Considering participant experiences across a range of devices matters. Participants who used mobile devices faced more challenges with certain activities, such as scenario ratings, suggesting that not all activities translate well across platforms. This is particularly noteworthy if any targeted demographic groups are known to prefer certain technologies or devices.
- Online discussion boards can be powerful tools for refining future survey questions. Much like cognitive interviews, they allowed us to delve into participants’ thought processes, making it possible to understand and account for the ways in which people might interpret survey prompts. This can lead to the development of survey questions that are clearer and more accurately capture the intended dimensions of a research topic.