Much of the data in this essay is drawn from the Religious Landscape Study (RLS). We also draw upon data collected from surveys conducted on Pew Research Center’s American Trends Panel (ATP) and data from the General Social Survey (GSS). We walk through the details of these data sources below. We also discuss how we measure trust and the models and analyses used in the report.
The Religious Landscape Study
The RLS is a national cross-sectional survey conducted for the Center by NORC at the University of Chicago. It was conducted in English and Spanish from July 17, 2023, to March 4, 2024, among a nationally representative sample of 36,908 respondents.
To recruit people to take the survey, we used a method known as address-based sampling (ABS). This involved mailing invitation letters to randomly sampled addresses from the U.S. Postal Service’s Computerized Delivery Sequence File. This approach gave nearly all U.S. adults a chance of being selected to participate in the survey.
People who received our invitation had the option of completing the survey online, on paper, or by calling a toll-free number and completing the survey by telephone with an interviewer. In total, 25,250 respondents participated online, 10,733 completed the survey on paper, and 925 participated by phone.
The survey is designed to be representative of all 50 states and the District of Columbia. The data is weighted (using benchmarks from the U.S. Census Bureau and other sources) to be representative of the adult population of each state (and D.C.) and the overall U.S. adult population by gender, age, race, ethnicity, education and other categories. The survey’s margin of error for results based on the full sample is plus or minus 0.8 percentage points. The response rate is 20%.
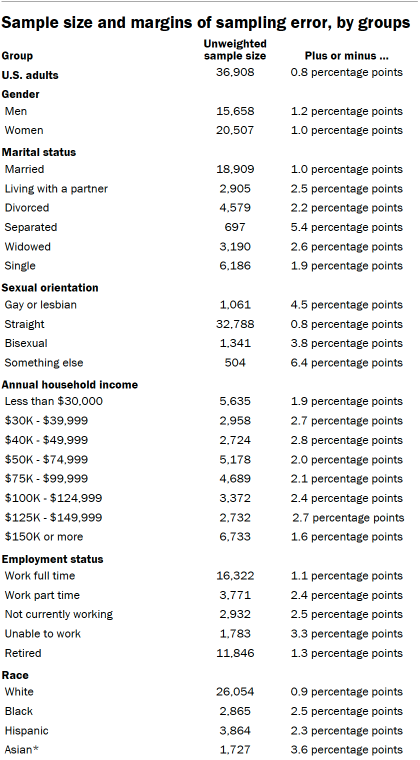
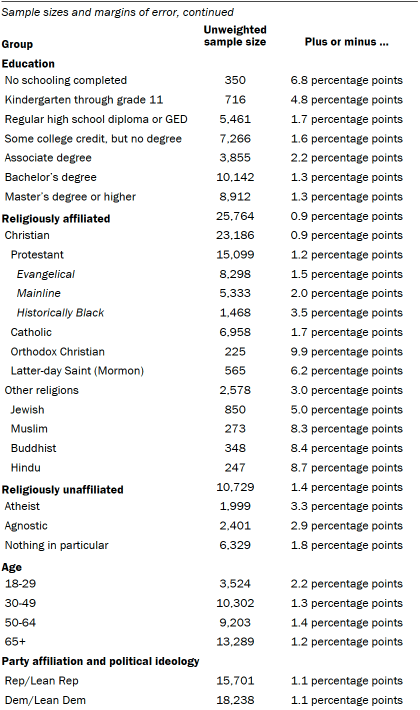
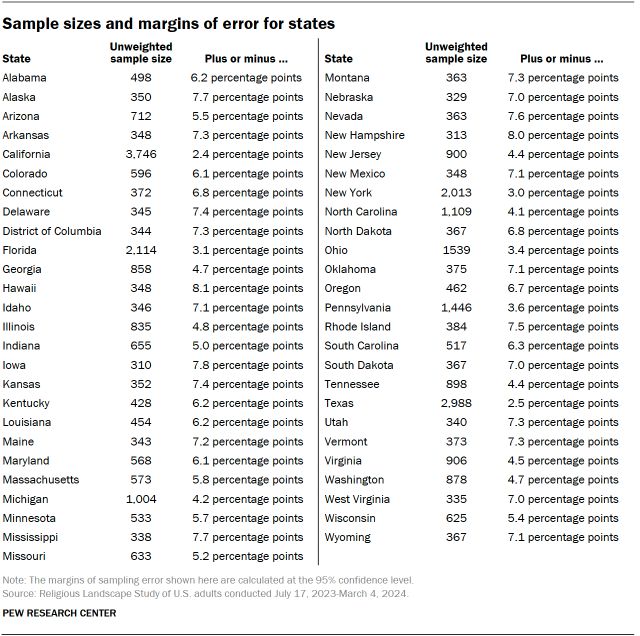
Sample sizes and margins of error
The following tables show the unweighted sample sizes and the error attributable to sampling that would be expected at the 95% level of confidence for different groups in the survey.
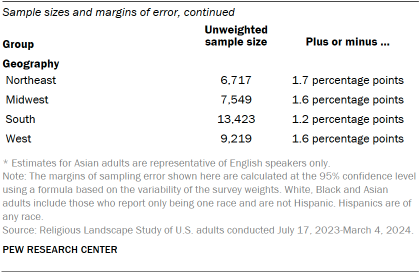
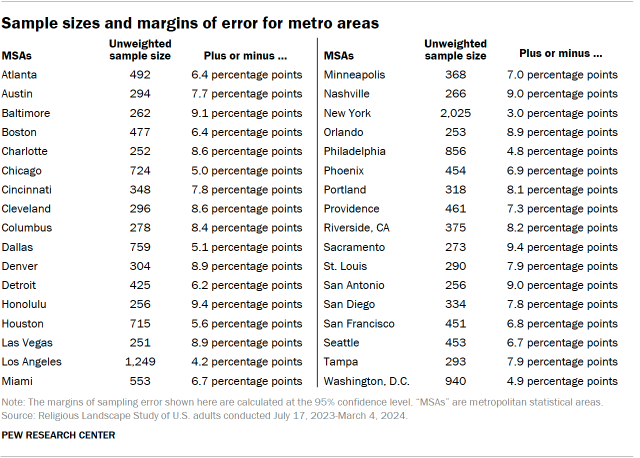
For more details, refer to the Religious Landscape Study’s Methodology.
American Trends Panel
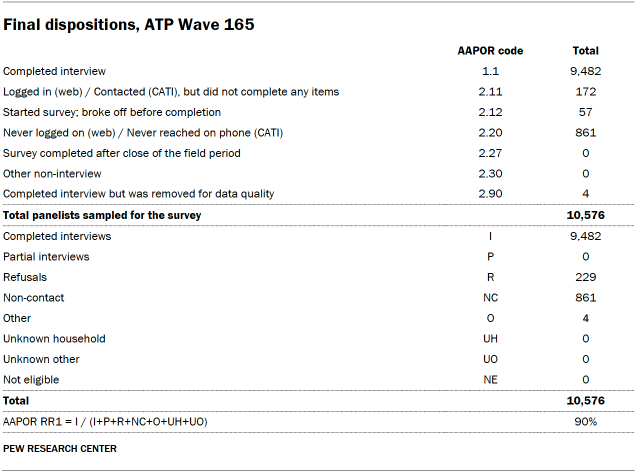
Data in this essay draws heavily on Wave 165 of the American Trends Panel (ATP), Pew Research Center’s nationally representative panel of randomly selected U.S. adults. The survey was conducted from March 10 to March 16, 2025. A total of 9,482 panelists responded out of 10,576 who were sampled, for a survey-level response rate of 90%.
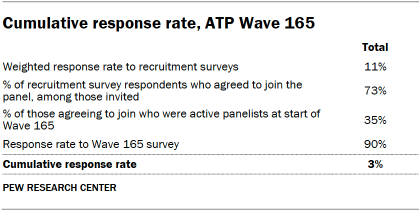
The cumulative response rate accounting for nonresponse to the recruitment surveys and attrition is 3%. The break-off rate among panelists who logged on to the survey and completed at least one item is 1%. The margin of sampling error for the full sample of 9,482 respondents is plus or minus 1.4 percentage points.
SSRS conducted the survey for Pew Research Center via online (n=9,231) and live telephone (n=251) interviewing. Interviews were conducted in both English and Spanish.
To learn more about the ATP, read “About the American Trends Panel.”
Panel recruitment
Since 2018, the ATP has used address-based sampling (ABS) for recruitment. A study cover letter and a pre-incentive are mailed to a stratified, random sample of households selected from the U.S. Postal Service’s Computerized Delivery Sequence File. This Postal Service file has been estimated to cover 90% to 98% of the population.1 Within each sampled household, the adult with the next birthday is selected to participate. Other details of the ABS recruitment protocol have changed over time but are available upon request.2 Prior to 2018, the ATP was recruited using landline and cellphone random-digit-dial surveys administered in English and Spanish.
A national sample of U.S. adults has been recruited to the ATP approximately once per year since 2014. In some years, the recruitment has included additional efforts (known as an “oversample”) to improve the accuracy of data for underrepresented groups. For example, Hispanic adults, Black adults and Asian adults were oversampled in 2019, 2022 and 2023, respectively.
Sample design
The overall target population for this survey was noninstitutionalized persons ages 18 and older living in the United States. All active panel members were invited to participate in this wave.
Questionnaire development and testing
The questionnaire was developed by Pew Research Center in consultation with SSRS. The web program used for online respondents was rigorously tested on both PC and mobile devices by the SSRS project team and Pew Research Center researchers. The SSRS project team also populated test data that was analyzed in SPSS to ensure the logic and randomizations were working as intended before launching the survey.
Incentives
All respondents were offered a post-paid incentive for their participation. Respondents could choose to receive the post-paid incentive in the form of a check or gift code to Amazon.com, Target.com or Walmart.com. Incentive amounts ranged from $5 to $20 depending on whether the respondent belongs to a part of the population that is harder or easier to reach. Differential incentive amounts were designed to increase panel survey participation among groups that traditionally have low survey response propensities.
Data collection protocol
The data collection field period for this survey was March 10 to March 16, 2025. Surveys were conducted via self-administered web survey or by live telephone interviewing.
For panelists who take surveys online:3 Postcard notifications were mailed to a subset on March 10.4 Survey invitations were sent out in two separate launches: soft launch and full launch. Sixty panelists were included in the soft launch, which began with an initial invitation sent on March 10. All remaining English- and Spanish-speaking sampled online panelists were included in the full launch and were sent an invitation on March 11.
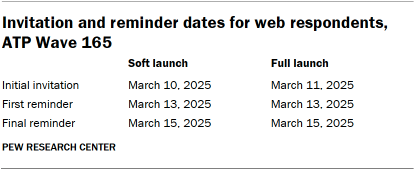
Panelists participating online were sent an email invitation and up to two email reminders if they did not respond to the survey. ATP panelists who consented to SMS messages were sent an SMS invitation with a link to the survey and up to two SMS reminders.
For panelists who take surveys over the phone with a live interviewer: Prenotification postcards were mailed on March 7. Soft launch took place on March 11 and involved dialing until a total of four interviews had been completed. All remaining English- and Spanish-speaking sampled phone panelists’ numbers were dialed throughout the remaining field period. Panelists who take surveys via phone can receive up to six calls from trained SSRS interviewers.
Data quality checks
To ensure high-quality data, Center researchers performed data quality checks to identify any respondents showing patterns of satisficing. This includes checking for whether respondents left questions blank at very high rates or always selected the first or last answer presented. As a result of this checking, four ATP respondents were removed from the survey dataset prior to weighting and analysis.
Weighting
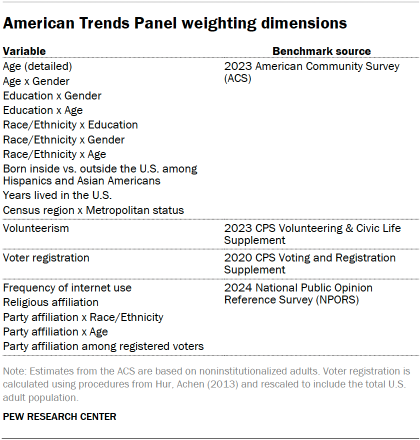
The ATP data is weighted in a process that accounts for multiple stages of sampling and nonresponse that occur at different points in the panel survey process. First, each panelist begins with a base weight that reflects their probability of recruitment into the panel. These weights are then calibrated to align with the population benchmarks in the accompanying table to correct for nonresponse to recruitment surveys and panel attrition. If only a subsample of panelists was invited to participate in the wave, this weight is adjusted to account for any differential probabilities of selection.
Among the panelists who completed the survey, this weight is then calibrated again to align with the population benchmarks identified in the accompanying table and trimmed at the 1st and 99th percentiles to reduce the loss in precision stemming from variance in the weights. Sampling errors and tests of statistical significance take into account the effect of weighting.
The following table shows the unweighted sample sizes and the error attributable to sampling that would be expected at the 95% level of confidence for different groups in the survey.
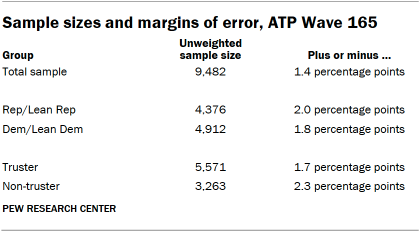
Sample sizes and sampling errors for other subgroups are available upon request. In addition to sampling error, one should bear in mind that question wording and practical difficulties in conducting surveys can introduce error or bias into the findings of opinion polls.
Dispositions and response rates
Note: Additional data in this essay is drawn from ATP Wave 162. For more about this survey, refer to its methodology.
General Social Survey
We report on the trend in social trust from the General Social Survey (GSS). The GSS is a national survey of American adults conducted by NORC at the University of Chicago since 1972. It generally has been conducted every two years since the 1990s. Through 2018, GSS data was collected mostly through in-person interviews. Due to the COVID-19 pandemic, the GSS was not fielded in 2020. The 2021 GSS was conducted mainly online, supplemented by telephone.
The change in data collection mode in the GSS after 2018 has raised questions about the comparability of trend measures. As a result, we have chosen not to report on the 2021 GSS.
Measuring trust
There is no universally accepted way to measure social trust, and different measures obtain different results. In this report we focus largely on one particular measure of social trust: whether “most people can be trusted,” or “you can’t be too careful in dealing with people.” We use this measure because it has a long history, both in our surveys and those conducted by the General Social Survey. It was also the question fielded as part of the largest single survey we conduct in the United States: the Religious Landscape Study.
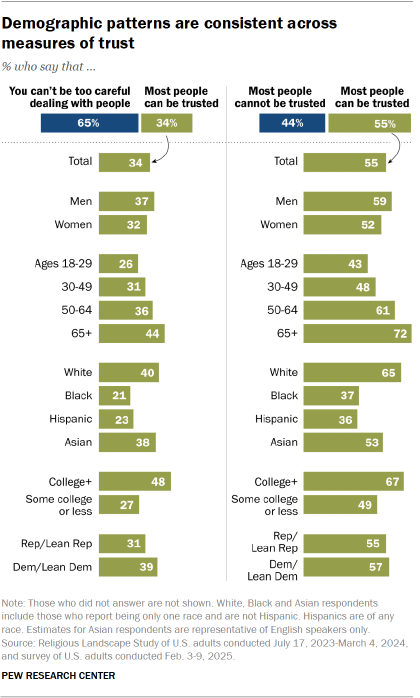
But alternative measures find different levels of trust. If we measure trust by asking whether most people can be trusted or most people cannot be trusted, we find substantially higher levels of trust. According to a February 2025 survey, 55% of Americans think most people can be trusted if the alternative is that most people cannot be trusted, rather than simply that one needs to be careful.
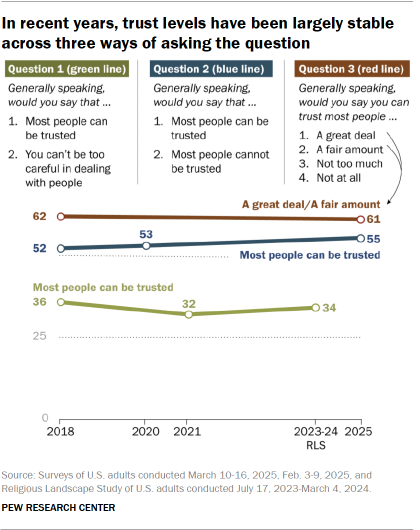
On this alternative measure, social trust has not fallen significantly over the past six years; 52% of Americans said most people could be trusted in 2018, and 55% said the same in February 2025. Notably, though, the patterns of who is trusting and who is not tend to be similar across both measures. Women, racial and ethnic minorities, younger people, those with less education and those with lower incomes tend to be less trusting across both measures.
A third measure of trust that we have also asked twice – in February and March 2018 and March 2025 – is similarly “flat” – meaning that trust did not increase or decrease. This question asks people, “Generally speaking, would you say you can trust most people a great deal, a fair amount, not too much, or not at all?” Results in both surveys, eight years apart, find that about six-in-ten Americans say you can trust people a great deal or fair amount. Demographic differences between men and women, age groups, racial and ethnic groups and more tend to largely mirror those found when we ask about trust in the ways described above.
Because social trust is a subjective concept, how people answer questions about it may depend on very specific features of the question. But even with the variation in results, questions about social trust are useful for comparing levels of trust across groups, between countries and across time.
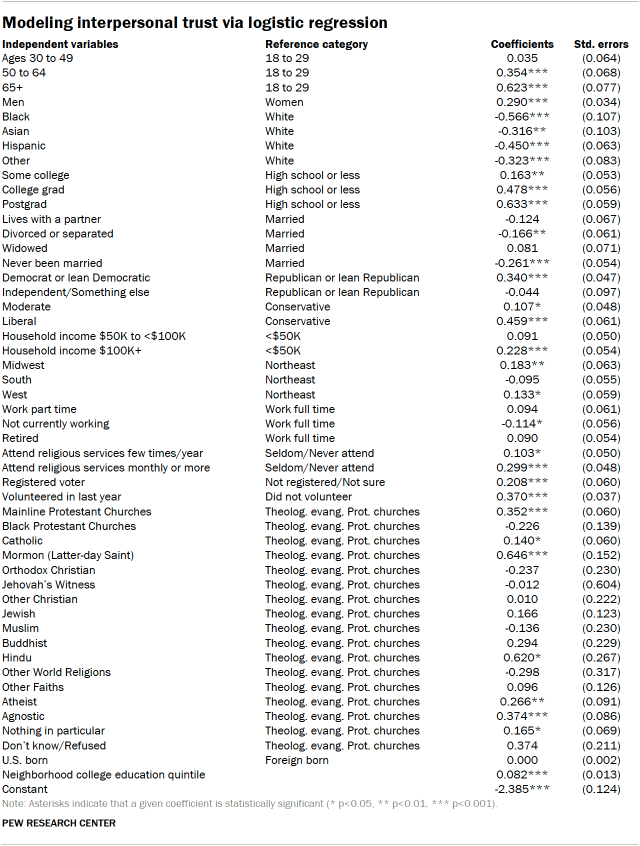
Modeling trust
In this essay, we explored factors related to how much interpersonal trust people have. To do this, we conducted a logistic regression, modeling who says “most people can be trusted” as a function of people’s demographic characteristics, as well as characteristics about their neighborhood.
Trust, the dependent variable, is a dichotomous dependent variable, where 1 denotes someone who says “most people can be trusted” and 0 means someone who says “you can’t be too careful” or did not respond to the question.
The independent variables include:
- Age – coded into categories for those ages 18 to 29, 30 to 49, 50 to 64, and 65 and older
- Gender – coded into categories for men and women
- Race – coded into categories for White, Black, Asian, Hispanic and “Other”
- Education – coded into categories for those who have a high school degree or less, some college, a bachelor’s degree or postgraduate degree
- Marital status – coded into categories for those who are married, living with a partner, divorced or separated, widowed, or never been married
- Partisan identification – a question about party identification and partisan leaning are coded together, creating categories for Democrats and those who lean toward the Democratic Party; Republicans and those who lean toward the Republican Party; and a third category for independents who do not lean, those who identify with other parties and those who say they “don’t know” or did not respond to the questions
- Ideology – coded into three categories for conservatives, moderates and liberals
- Income – coded into three categories for those with total household income of less than $50,000, $50,000 to less than $100,000, and $100,000 or more
- Region – coded based on which of the four census regions a respondent lives in: Northeast, Midwest, South and West
- Employment – coded into categories to reflect full-time work, part-time work, those who are not currently working for pay or who are unable to work due to a disability, and those who are retired
- Religious attendance – coded into those who seldom or never attend religious services, those who attend a few times a year, and those who attend at least monthly
- Voter – coded into those who are registered to vote and those who are either not registered or are not sure
- Volunteer – coded into those who say they spent time volunteering for an organization or association in the past 12 months and those who did not
- Religious affiliation – coded to reflect the religious categories the Center typically uses to classify respondents, with categories including: theologically evangelical Protestant, mainline Protestant, historically Black Protestant, Catholic, Mormon (Latter-day Saint), Orthodox Christian, Jehovah’s Witness, other Christian, Jewish, Muslim, Buddhist, Hindu, other world religions, other faiths, agnostic, atheist, those who say that their religion is “nothing in particular,” and those who say they “don’t know” or did not respond to the question
- Nativity – coded to reflect those who were born in one of the 50 U.S. states, D.C., Puerto Rico, or another U.S. territory and those who were born in another country
The models used in our analysis do not include respondents who did not answer or who said they “don’t know” on the variables included above, unless explicitly noted otherwise. People who described their gender “in some other way” are also excluded. However, the results are similar in models that include these respondents. Aside from religious attendance, all variables were put into the model as dummy or categorical variables, rather than continuous variables.
How the effects of location were assessed
To assess the possible impact of where one lives on social trust, we examined a range of characteristics of the neighborhoods where our Religious Landscape Study respondents lived. The goal was to gauge whether people’s social trust was affected by the neighborhood they live in, once we took into account the fact that different kinds of people live in different neighborhoods.
Neighborhood characteristics were obtained from the U.S. Census Bureau’s Planning Database, which contains demographic and economic statistics drawn from the decennial census and the American Community Survey five-year files. The statistics are available at the census block group level; block groups are smaller than census tracts and contain anywhere from a few hundred to a few thousand people.
Measures of neighborhood education and political preference
The census database contained measures of several characteristics that could affect social trust, among them the share who are college graduates, non-Hispanic White, have no health insurance, live in an owner-occupied dwelling and receive some sort of public assistance.
For each demographic or political characteristic, the survey’s respondents were sorted into five roughly equal sized groups (or “quintiles”) ranging from lowest to highest scores on the characteristics of the places where they live. For example, for the share who are college graduates in a census block group, the block groups of the respondents were sorted from the lowest share to the highest share and divided into five roughly equal groups that ranged from an average college graduate share of 8% in the lowest quintile to 68% in the highest quintile.
After testing the possible impact of several neighborhood characteristics on trust using the multivariate model, education emerged as one of the most consequential and was retained for the final model.
Demonstrating the independent impact of place
To show the consequences of living in different locations after accounting for differences in the kinds of people who live in each place, the multivariate model was used to produce an estimate of the likelihood of trusting or not trusting (a probability) for a hypothetical individual whose individual demographic attributes are set to the average.
Regression results
The table below presents the results of a logistic regression. The coefficients show how much each factor (such as being Black) affects the odds of saying that people can be trusted. Asterisks indicate that a given coefficient is statistically significant (* p<0.05, ** p<0.01, *** p<0.001). Positive coefficients that are significant indicate that the factor increases the odds of saying that people can be trusted, while negative coefficients that are significant indicate that the factor decreases those odds. The model was run with replicate weights.
Measuring changes in trust over time
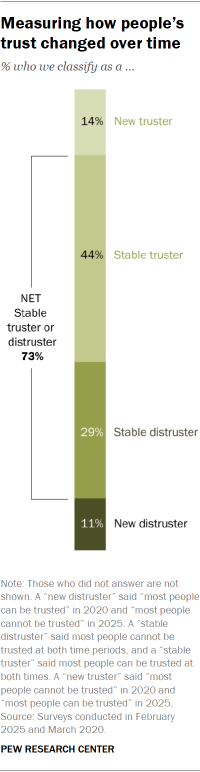
We also conducted a longitudinal analysis examining how individuals’ levels of interpersonal trust changed over time. Pew Research Center asked the same individuals whether or not most people can be trusted in March of 2020 (starting about a week after the World Health Organization declared COVID-19 a pandemic), and again in 2025. This analysis is based on 4,451 people who participated in the following two ATP waves:
- February 2025 (Wave 162)
- March 2020 (Wave 64)
Most respondents (73%) had stable levels of trust, giving the same response in both years. Gaining trust (14%) was slightly more common than losing trust (11%) among those whose responses changed. And 2% did not answer at least one of the two questions about trust.
Assessing what factors related to changing trust
Americans in September 2019 (Wave 54) were asked about their household’s financial situation – with answer options ranging from “live comfortably” to “don’t even have enough to meet basic expenses.” Of the 4,451 participants who participated in the March 2020 and February 2025 surveys, 2,751 had also participated in the September 2019 survey.
A longitudinal population-averaged logistic regression model was used to test change in interpersonal trust between 2020 and 2025, and controlled for gender, birth decade, race and ethnicity, educational attainment, and household financial situation. Individuals in the longitudinal analysis received a custom weight accounting for their participation in the multiple waves used in analysis. The regression excluded those who did not answer the questions about trust in one or both waves.
This population-averaged approach has the advantage of estimating effects across entire populations by focusing on average relationships between variables while accounting for within-person correlation and survey sampling weights.
U.S. racial and ethnic composition, 1960 to 2060
For data on the United States’ racial and ethnic composition, the U.S. population is divided into five mutually exclusive groups:
- Hispanic alone
- White alone and not Hispanic
- Black alone and not Hispanic
- Asian alone and not Hispanic
- “All other,” which includes American Indian/Alaska Native (AIAN) alone who are not Hispanic and those who report two or more races who are not Hispanic.
For 1960-2015, non-Hispanic Pacific Islanders (which includes Native Hawaiians) are included with Asians; for 2023-2060, this group is included in the category “All other.” Hispanics are of any race.
National historical projections for 1960 to 2015 are based on those found in this Pew Research Center report. For more details, read the report’s methodology. Data for 2023 is based on Center tabulations of the 2023 American Community Survey via IPUMS’s online tabulator. Data for 2030-2060 is based on U.S. Census Bureau 2023 National Population Projections using the published middle series.
